Fig. 4
Download original image
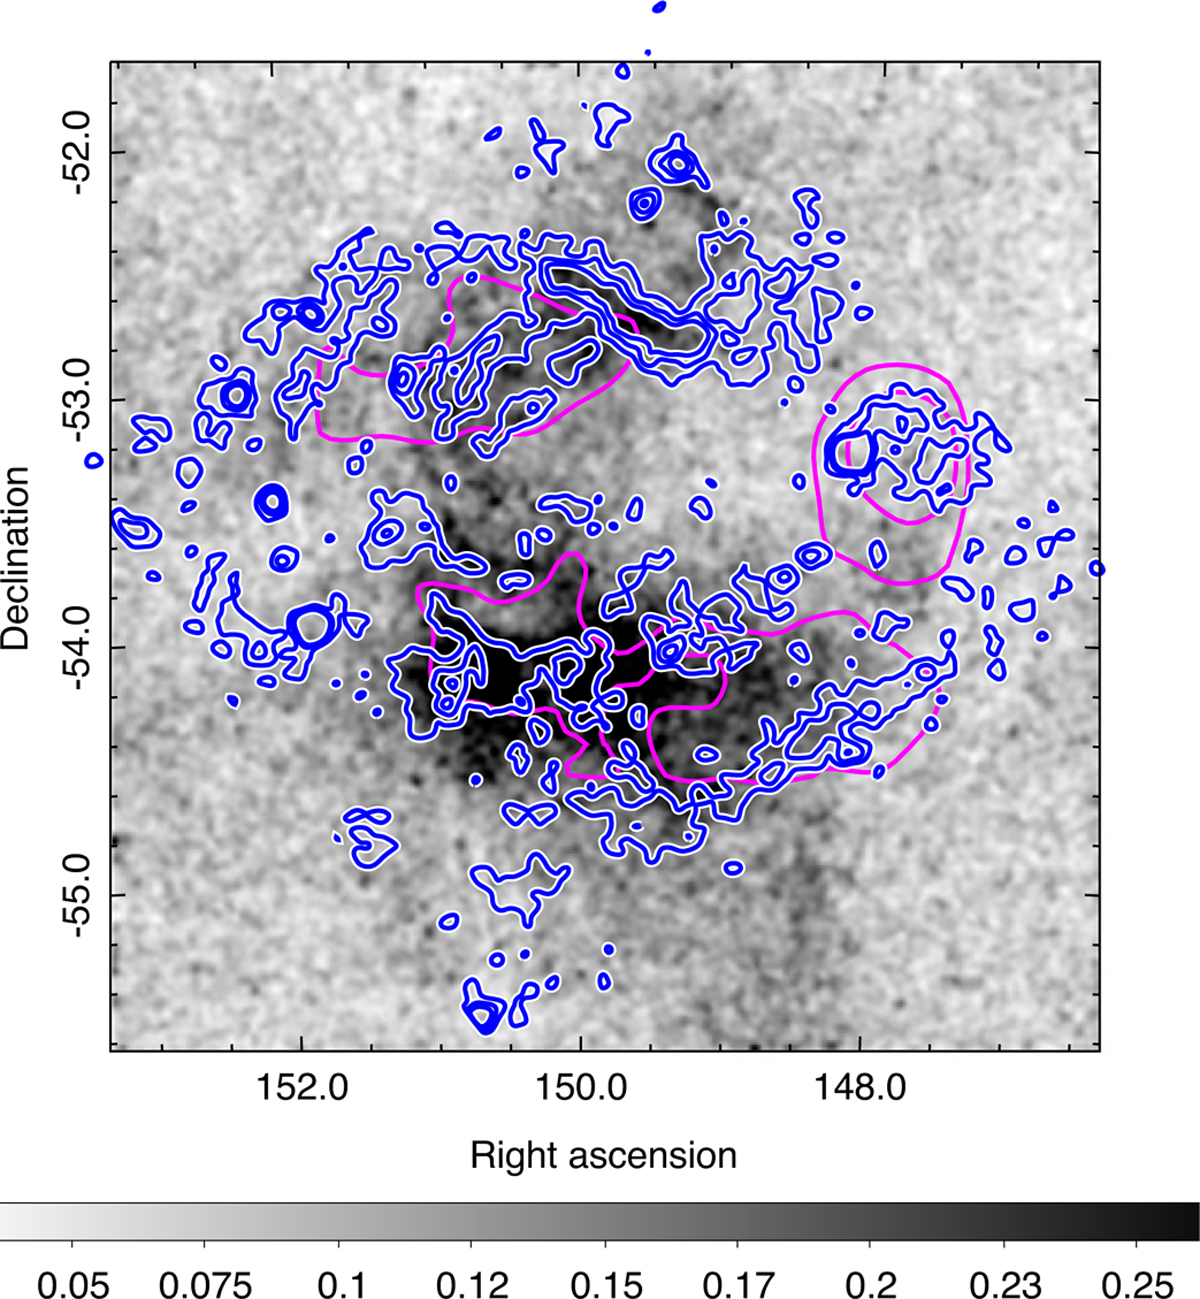
eRASS:4 exposure-corrected intensity sky map, with identical parameters as the one displayed in Fig. 1. The blue contours mark the 4850 MHz radio data obtained from PMN (Condon et al. 1993) southern and tropical surveys, and GB6 (Condon et al. 1991, 1994). The magenta contours mark the optical Hα data obtained from the full-sky Hα map of Finkbeiner (2003), with 6′ FWHM resolution.
Current usage metrics show cumulative count of Article Views (full-text article views including HTML views, PDF and ePub downloads, according to the available data) and Abstracts Views on Vision4Press platform.
Data correspond to usage on the plateform after 2015. The current usage metrics is available 48-96 hours after online publication and is updated daily on week days.
Initial download of the metrics may take a while.