Fig. 3
Download original image
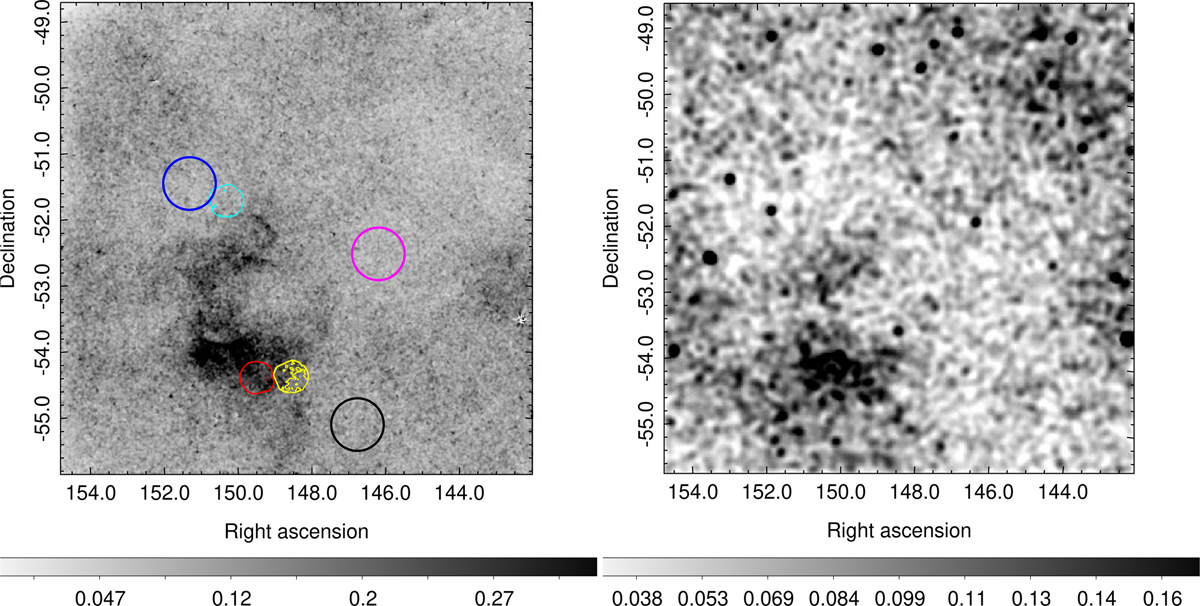
Comparison of eROSITA and ROSAT view of the remnant. Left panel: eRASS:4 exposure-corrected intensity sky map in the 0.4–2.4 keV energy band, in units of counts per pixel with a pixel size of 10″. Point sources are filtered out, and the image is convolved with a σ = 45″ Gaussian. The black, magenta, and blue circles represent the three background control regions that we have selected to inspect potential background variations in the remnant’s Galactic vicinity. Among those, the black circle was selected as the representative background used for the spectral analysis of the on-source regions, see Sect. 4.1 for more details. Red, yellow, and cyan circles mark the positions of the 0823031001, 0823030401, and 0823030301 XMM-Newton pointings, respectively. Within each circle one level contours are used, of identical scale for all three pointings, aiming at illustrating regions of enhanced X-ray emission. Right panel: ROSAT intensity sky map in the 0.4–2.4 KeV energy band (medium RASS band). The image, with a 45″ pixel size, is convolved with a σ = 3′ Gaussian to enhance the visibility of the diffuse emission from the location of the remnant. Point sources are not removed since their proper masking requires a substantially larger extraction radius than for eROSITA, which heavily affects the faint diffuse emission originating from the remnant.
Current usage metrics show cumulative count of Article Views (full-text article views including HTML views, PDF and ePub downloads, according to the available data) and Abstracts Views on Vision4Press platform.
Data correspond to usage on the plateform after 2015. The current usage metrics is available 48-96 hours after online publication and is updated daily on week days.
Initial download of the metrics may take a while.