Fig. 12
Download original image
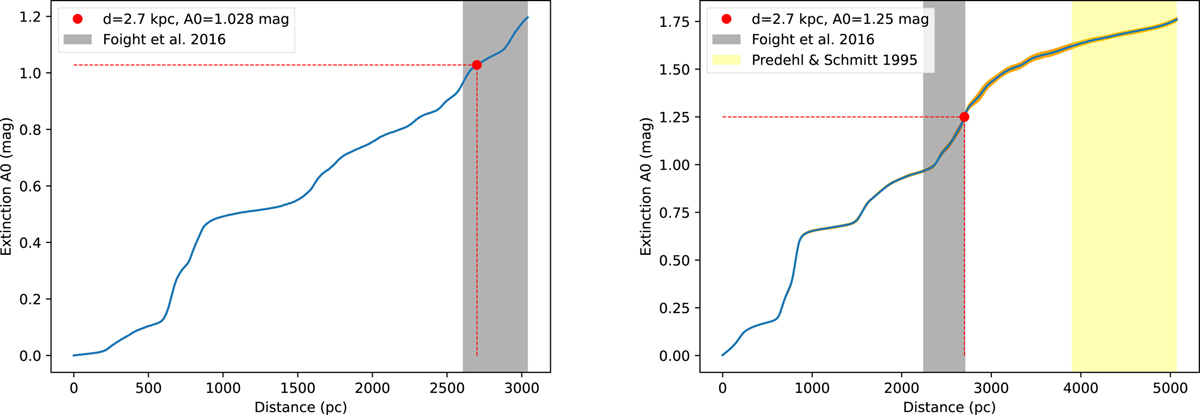
Cumulative extinction in the direction of G279.0+01.1. Left panel: one-dimensional cumulative extinction graph as a function of the distance up to ~3 kpc (Lallement et al. 2019 data sets) toward G279.0+01.1 SNR, obtained by using the Gaia-2MASS tool for one-dimensional extinction computation https://astro.acri-st.fr/gaia_dev/. Right panel: one-dimensional cumulative extinction graph as a function of the distance up to ~5 kpc (updated Lallement et al. 2022 data sets) toward G279.0+01.1 SNR, obtained by using the EXPLORE G-Tomo tool for one-dimensional extinction computation https://explore-platform.eu/. In both panels, the gray-shaded areas correspond to the distance uncertainty estimation when employing Eq. (2) and the obtained best-fit value of the absorption column density derived from the spectral analysis. The yellow area indicates the distance uncertainty range when employing Eq. (1). The red point represents the obtained extinction when assuming that the remnant is located at a distance of 2.7 kpc.
Current usage metrics show cumulative count of Article Views (full-text article views including HTML views, PDF and ePub downloads, according to the available data) and Abstracts Views on Vision4Press platform.
Data correspond to usage on the plateform after 2015. The current usage metrics is available 48-96 hours after online publication and is updated daily on week days.
Initial download of the metrics may take a while.