Fig. 1
Download original image
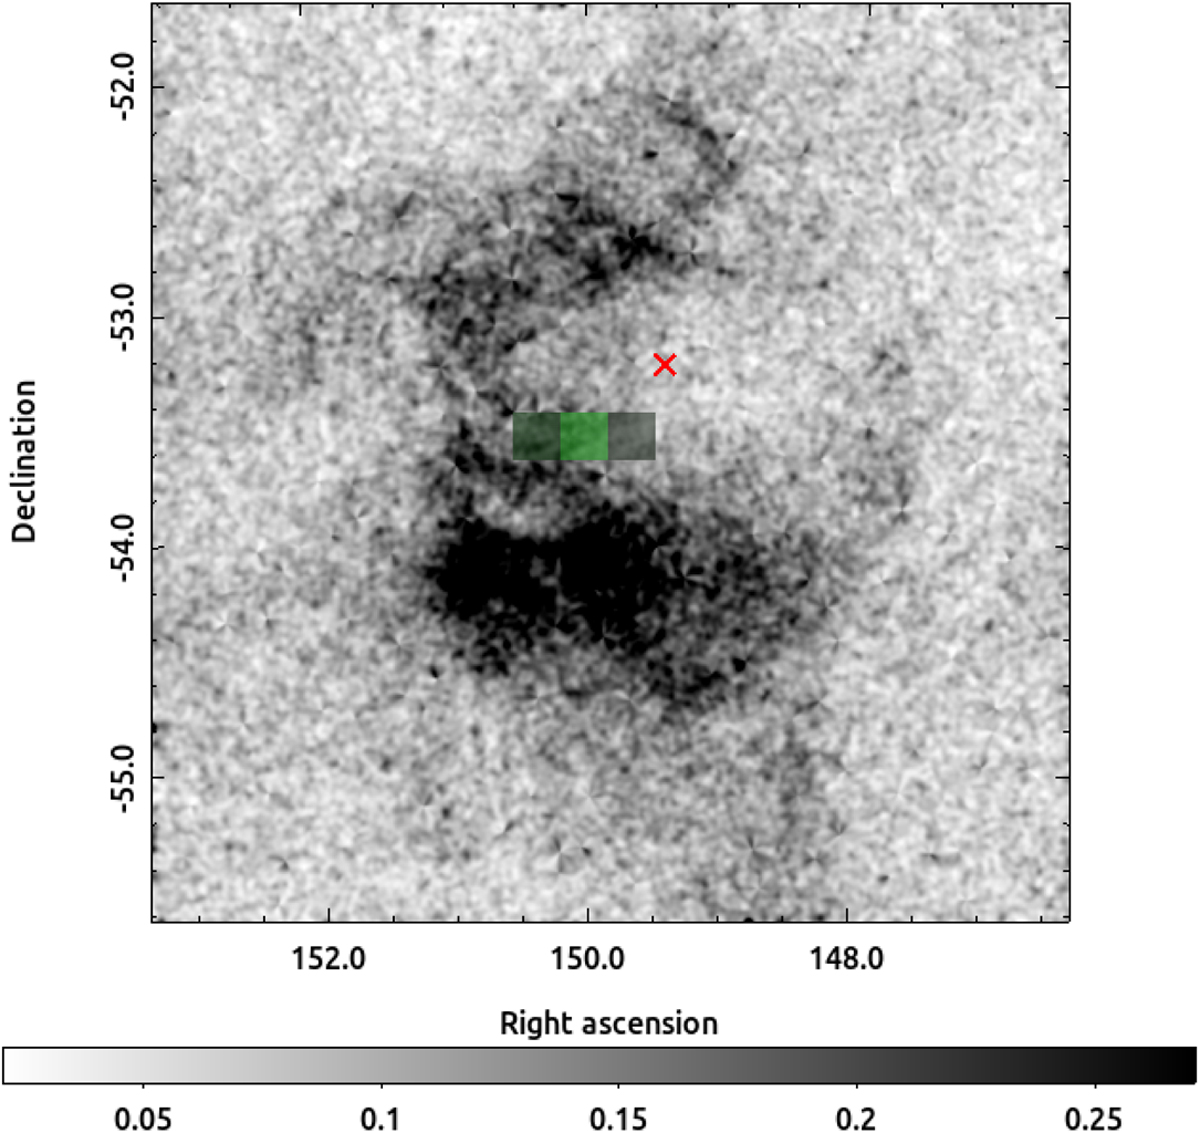
eRASS:4 exposure-corrected intensity sky map in the 0.3–1.1 keV energy band, in units of counts per pixel with a pixel size of 10″. Point sources have been filtered out, and the image has been convolved with a σ = 45″ Gaussian to enhance the visibility of the diffuse X-ray emission originating from the source. The geometrical center of the X-ray emission from a Minkowski tensor analysis is shown by the green boxes. A brighter box means a higher probability to represent the center. The red cross indicates the remnant’s center based on previous radio measurements.
Current usage metrics show cumulative count of Article Views (full-text article views including HTML views, PDF and ePub downloads, according to the available data) and Abstracts Views on Vision4Press platform.
Data correspond to usage on the plateform after 2015. The current usage metrics is available 48-96 hours after online publication and is updated daily on week days.
Initial download of the metrics may take a while.