Fig. 9
Download original image
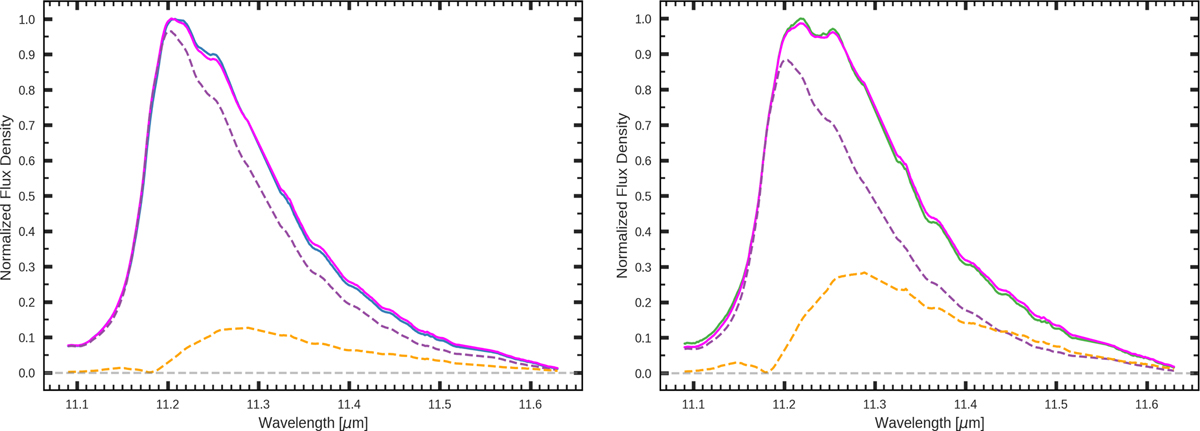
Linear combinations of the class A11.2 profile and a ‘secondary component’ that recover the ‘intermediate’ 11.2 μm profiles of clusters 3 (left) and 2 (right) from the 10.9–11.63 μm wavelength region (see Sect. 5.4 for details). The cluster profile is shown in blue and green in the left and right panel respectively. The dashed purple line represents the scaled class A11.2 profile given by cluster 4, the dashed orange line is the secondary component, and the bright magenta line represents the linear combination of these two components. We note that the small undulations in the red wing of the profiles are residual fringes present due to incomplete fringe removal.
Current usage metrics show cumulative count of Article Views (full-text article views including HTML views, PDF and ePub downloads, according to the available data) and Abstracts Views on Vision4Press platform.
Data correspond to usage on the plateform after 2015. The current usage metrics is available 48-96 hours after online publication and is updated daily on week days.
Initial download of the metrics may take a while.