Fig. 8
Download original image
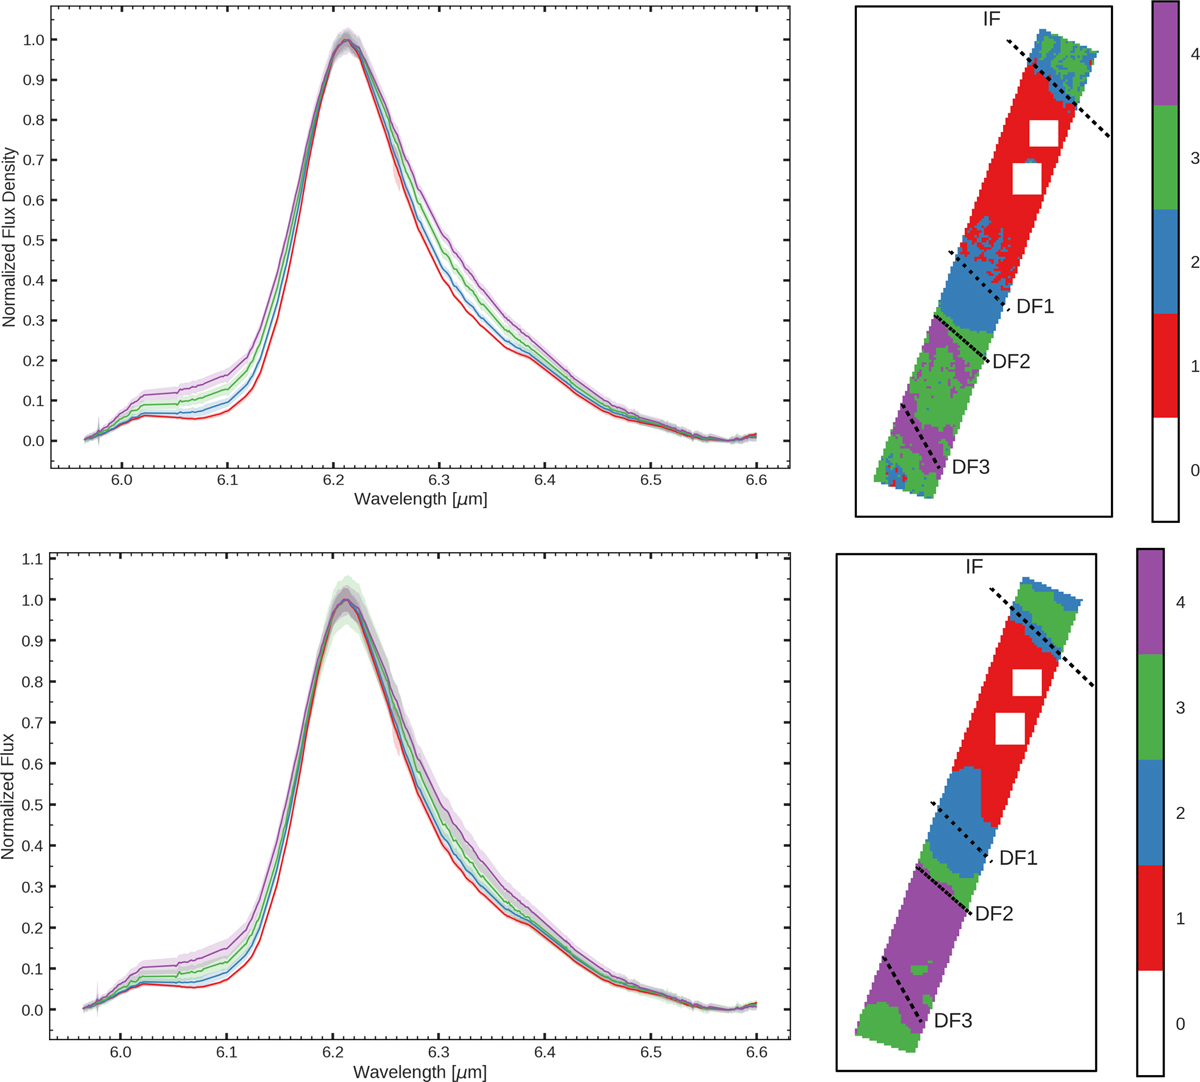
Average spectral profiles (left) for the 6.2 μm band obtained from clustering assignment based on the 5.95–6.6 μm region and the corresponding cluster zones (right) are given in the top two frames. The average spectral profiles (left) for the 6.2 μm band obtained from clustering assignment based on the 10.9–11.63 μm region and the corresponding cluster zones (right) are given in the bottom two frames. Left panels: the shaded regions around each profile illustrate one standard deviation from the mean profile intensity at a given wavelength value. Each spectrum is normalised to the peak 6.2 μm intensity for visualisation purposes. Right panels: the spatial footprint of the MIRI MRS FOV colour-coded by cluster assignment. Any masked pixels or those that have been otherwise masked out are labelled as 0. The black, dashed lines illustrate the locations of the ionisation front (IF) and the three dissociation fronts (DF 1, DF 2 and DF 3) as defined in Peeters et al. (2024) using nomenclature established in Habart et al. (2024).
Current usage metrics show cumulative count of Article Views (full-text article views including HTML views, PDF and ePub downloads, according to the available data) and Abstracts Views on Vision4Press platform.
Data correspond to usage on the plateform after 2015. The current usage metrics is available 48-96 hours after online publication and is updated daily on week days.
Initial download of the metrics may take a while.