Fig. 2
Download original image
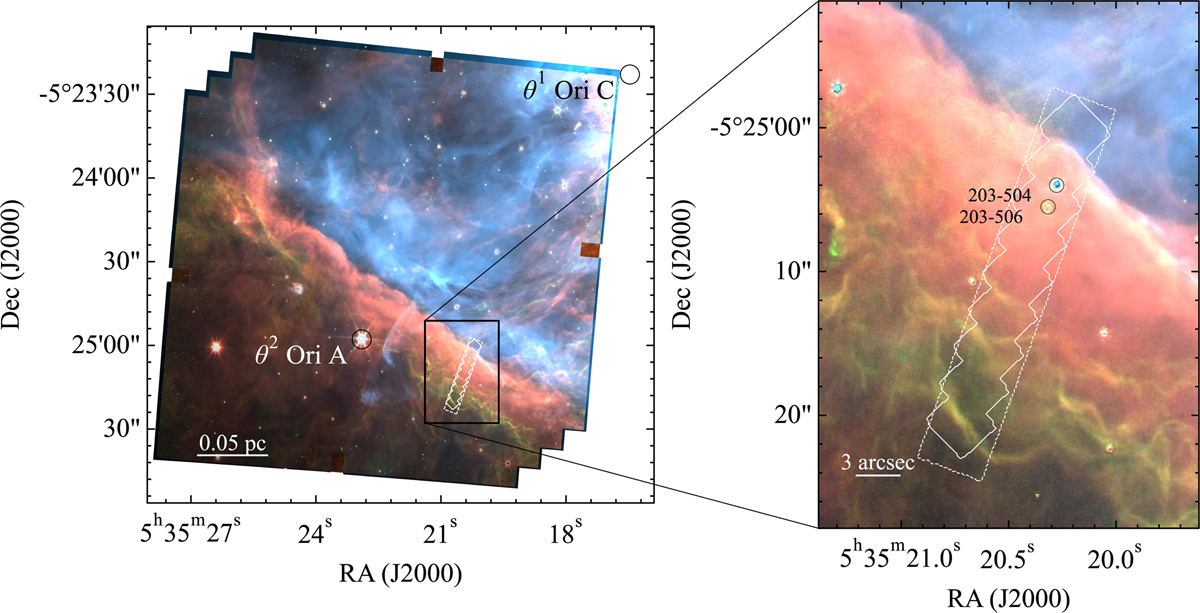
PDRs4All FOVs for both NIRSpec IFU and MIRI MRS datasets are illustrated with the solid and dashed white lines, respectively. The FOVs are overlaid on a composite NIRCam image of the Bar constructed from PDRs4All imaging data (Habart et al. 2024), where red, green, and blue are encoded as F335M (3.3 μm aromatic infrared band emission), F470N-F444W (H2 emission), and F187N (Paschen α emission), respectively. The location of the ionising source, θ1 Ori C, is shown with the white circle in the top right corner of the left panel. The two proplyds, 203–504 and 203–506, are outlined with black circles. Figure adapted from Chown et al. (2024).
Current usage metrics show cumulative count of Article Views (full-text article views including HTML views, PDF and ePub downloads, according to the available data) and Abstracts Views on Vision4Press platform.
Data correspond to usage on the plateform after 2015. The current usage metrics is available 48-96 hours after online publication and is updated daily on week days.
Initial download of the metrics may take a while.