Fig. C.1
Download original image
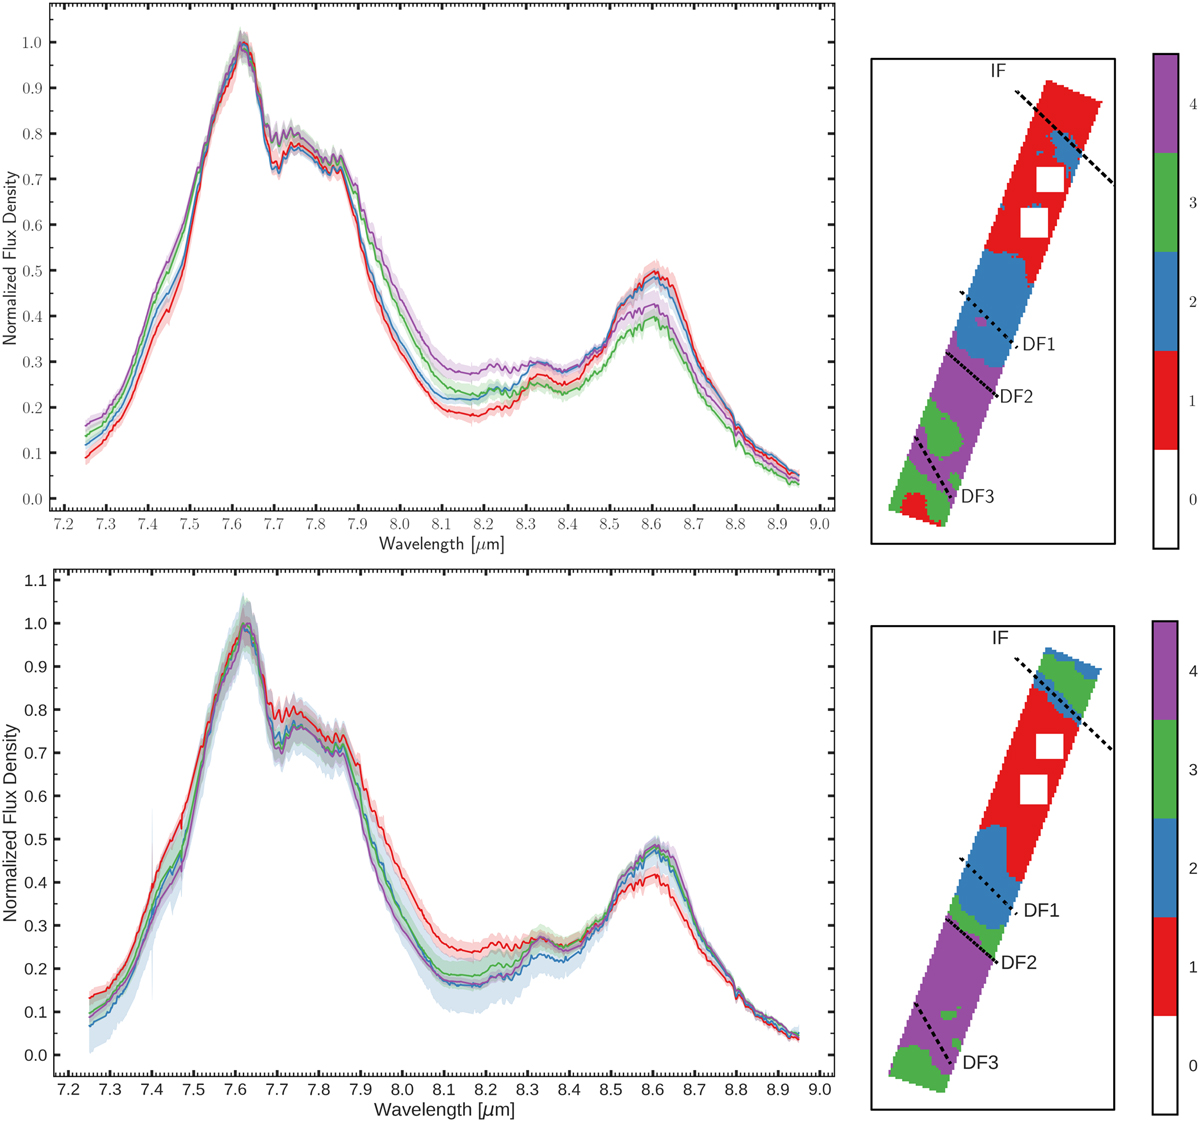
Average spectral profiles (left) for the 7.25–8.95 μm region obtained from clustering assignment based on the 7.25–8.95 μm region and the corresponding cluster zones (right) are given in the top two frames. The average spectral profiles (left) for the 7.25–8.95 μm region obtained from clustering assignment based on the 10.9–11.63 μm region and the corresponding cluster zones (right) are given in the bottom two frames. Cluster and FOV labels are the same as in Fig. 8.
Current usage metrics show cumulative count of Article Views (full-text article views including HTML views, PDF and ePub downloads, according to the available data) and Abstracts Views on Vision4Press platform.
Data correspond to usage on the plateform after 2015. The current usage metrics is available 48-96 hours after online publication and is updated daily on week days.
Initial download of the metrics may take a while.