Open Access
Fig. A.1
Download original image
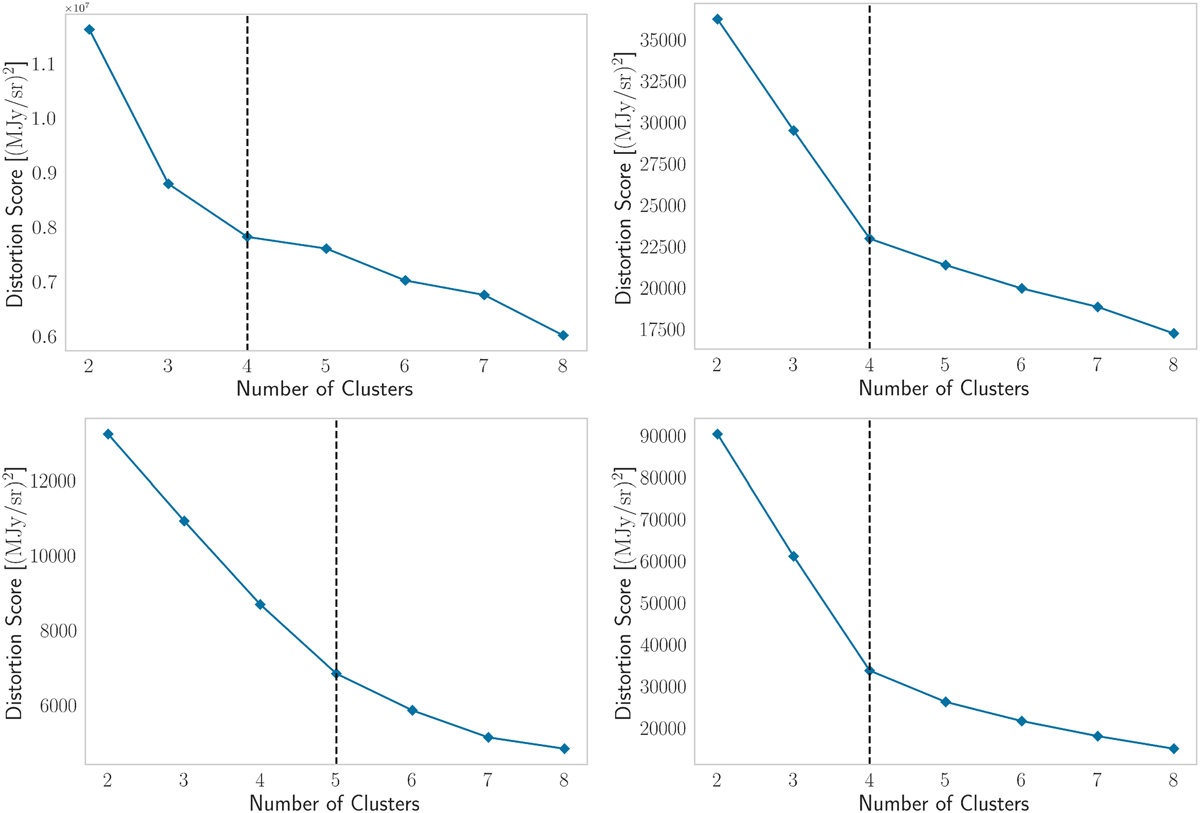
Distortion scores for clustering applied in the 3.2–3.6, 5.95–6.6, 7.25–8.95, and 10.9–11.63 μm region plotted as a function of the number of clusters used. The inflection point, or ‘elbow’, in the distortion curve is highlighted with the dashed black line. As is shown, four clusters are optimal for each wavelength regime.
Current usage metrics show cumulative count of Article Views (full-text article views including HTML views, PDF and ePub downloads, according to the available data) and Abstracts Views on Vision4Press platform.
Data correspond to usage on the plateform after 2015. The current usage metrics is available 48-96 hours after online publication and is updated daily on week days.
Initial download of the metrics may take a while.