Fig. 8
Download original image
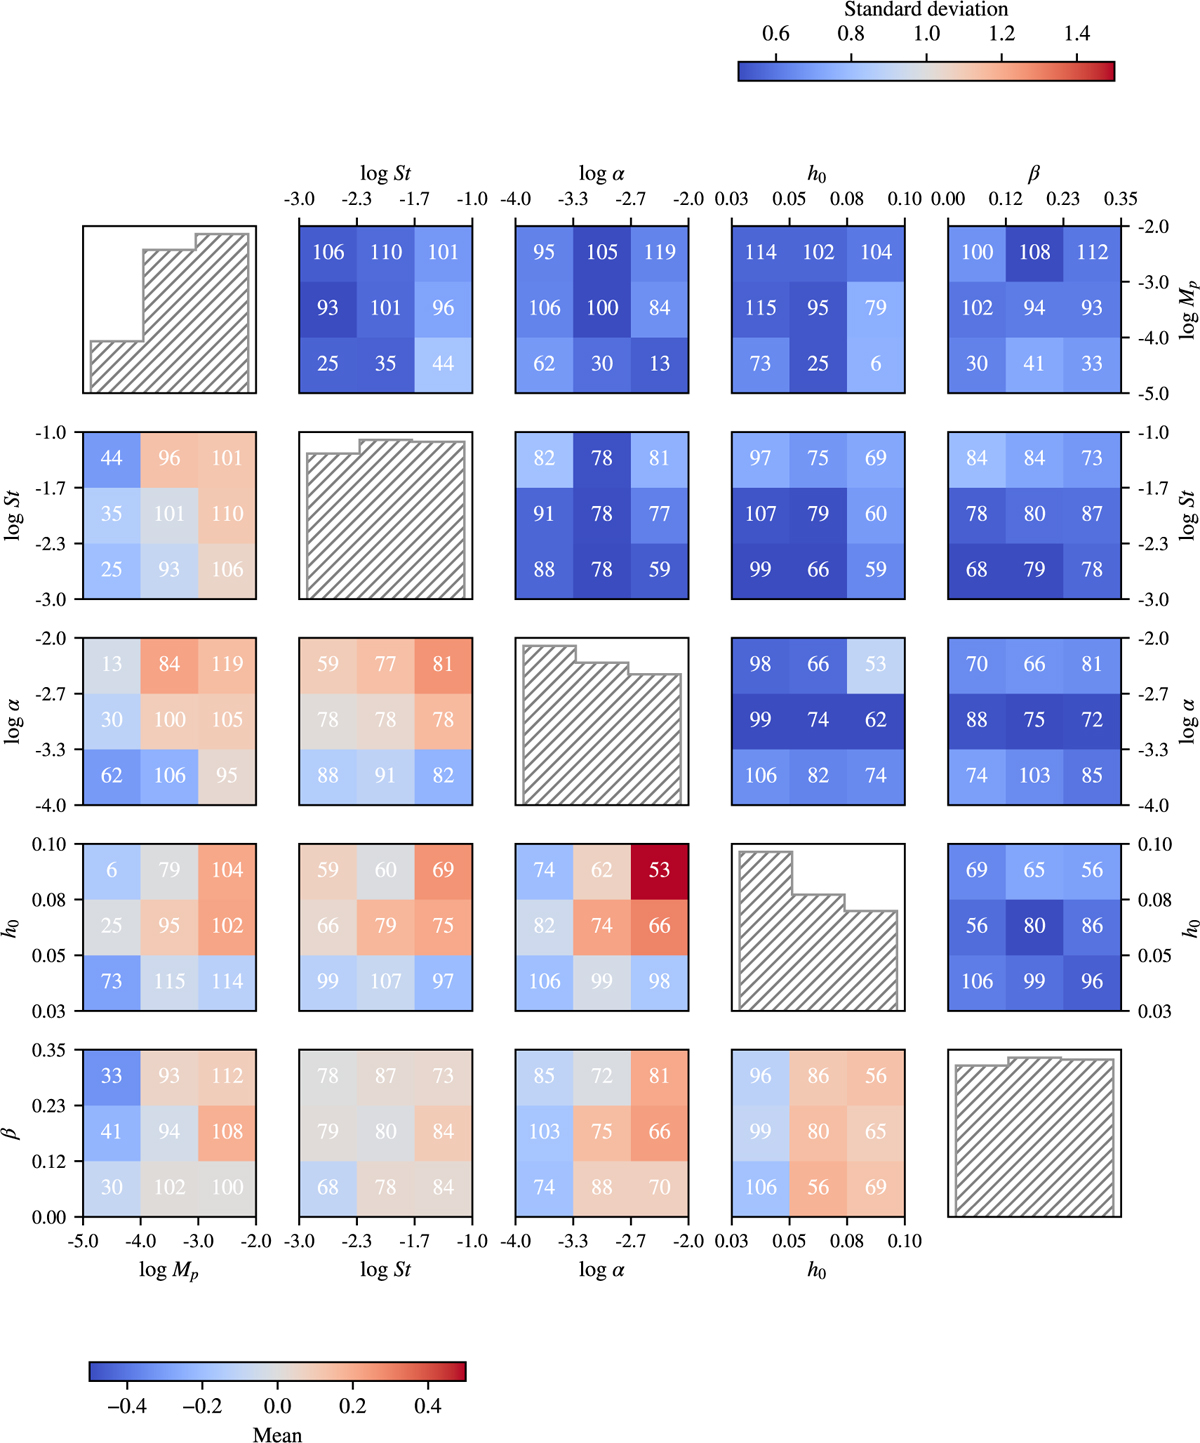
Mean (bottom left corner) and standard deviation (top right corner) of the distribution of standardized errors evaluated on the test set across the parameter space. The histograms on the diagonal are indicative of how the test set images are distributed in the parameter space. We reported inside each cell the number of elements of the test set lying in that region and thus used to compute the moments of the standardized error distribution.
Current usage metrics show cumulative count of Article Views (full-text article views including HTML views, PDF and ePub downloads, according to the available data) and Abstracts Views on Vision4Press platform.
Data correspond to usage on the plateform after 2015. The current usage metrics is available 48-96 hours after online publication and is updated daily on week days.
Initial download of the metrics may take a while.