Fig. 7
Download original image
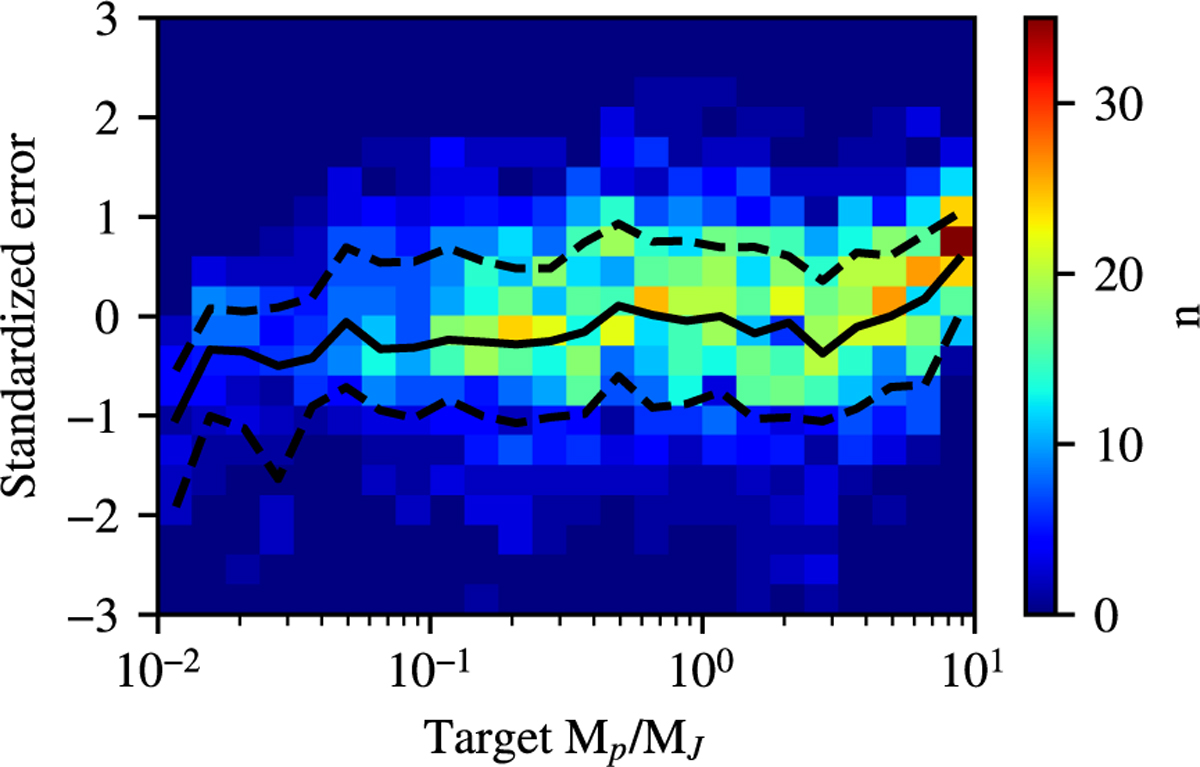
Two-dimensional distribution of the standardized error as a function of the target mass. The black line marks the median of each distribution at a fixed target mass while the dashed lines mark respectively the 16th and 84th percentiles. The graph shows a distribution in fine agreement with the expected one for planets of masses approximately between 10 M⊕ and 6 MJ (assuming M★ = 1 M⊙). Lower and higher masses are instead, respectively, systematically overestimated or underestimated.
Current usage metrics show cumulative count of Article Views (full-text article views including HTML views, PDF and ePub downloads, according to the available data) and Abstracts Views on Vision4Press platform.
Data correspond to usage on the plateform after 2015. The current usage metrics is available 48-96 hours after online publication and is updated daily on week days.
Initial download of the metrics may take a while.