Open Access
Fig. 5
Download original image
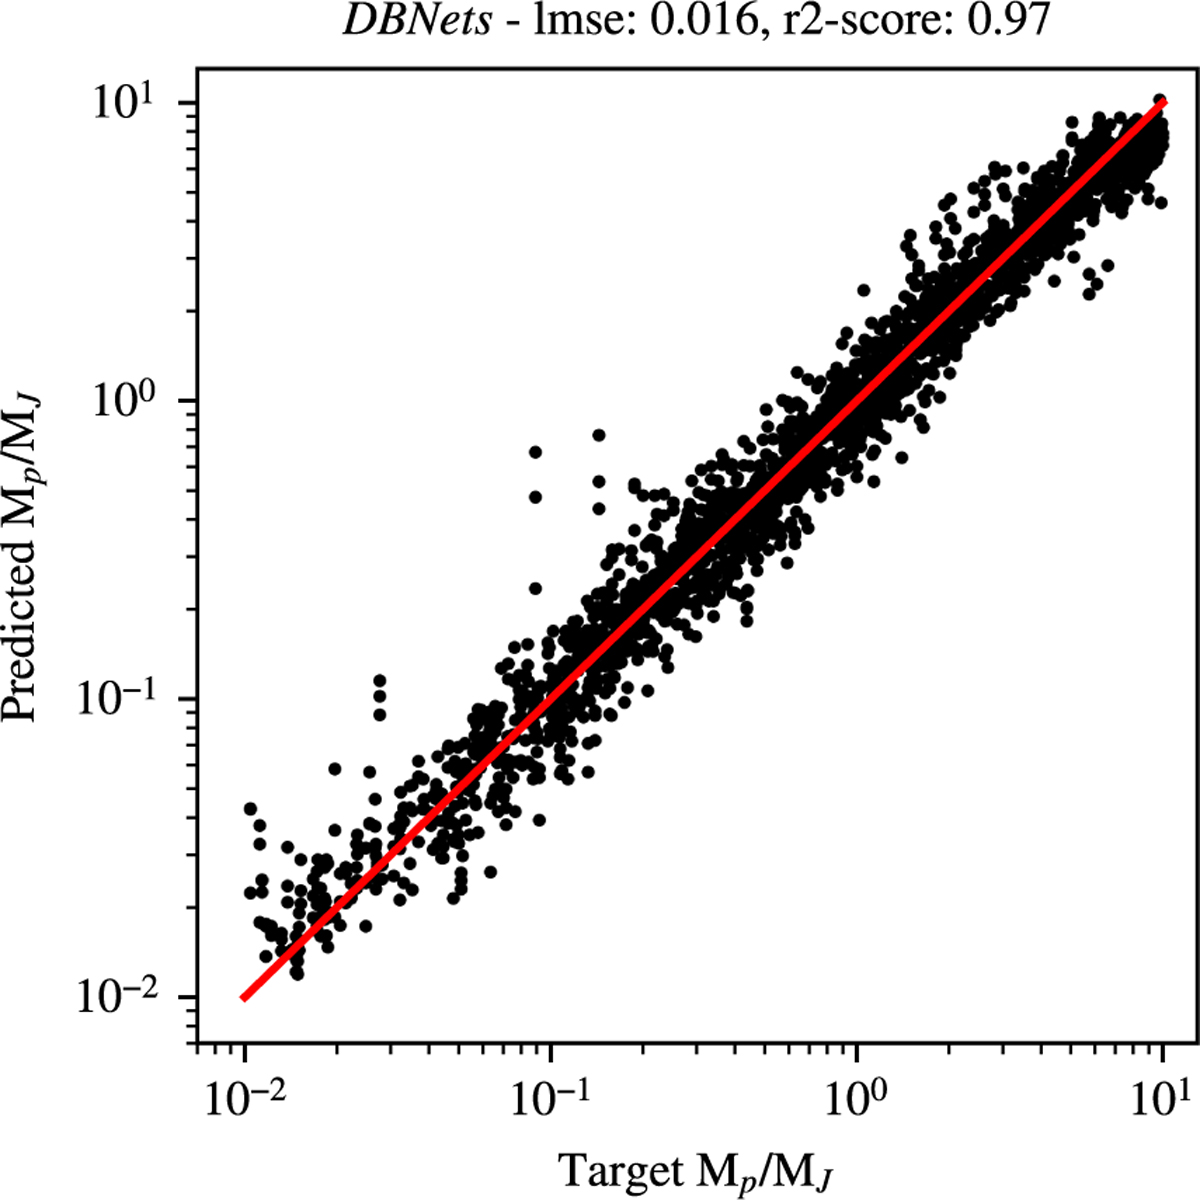
Scatter plot showing the correlation, in the results obtained on the test set, between the target planet mass and the estimate of the ensemble of CNNs (DBNets). The red line marks the ideal exact correlation that is targeted.
Current usage metrics show cumulative count of Article Views (full-text article views including HTML views, PDF and ePub downloads, according to the available data) and Abstracts Views on Vision4Press platform.
Data correspond to usage on the plateform after 2015. The current usage metrics is available 48-96 hours after online publication and is updated daily on week days.
Initial download of the metrics may take a while.