Fig. C.1
Download original image
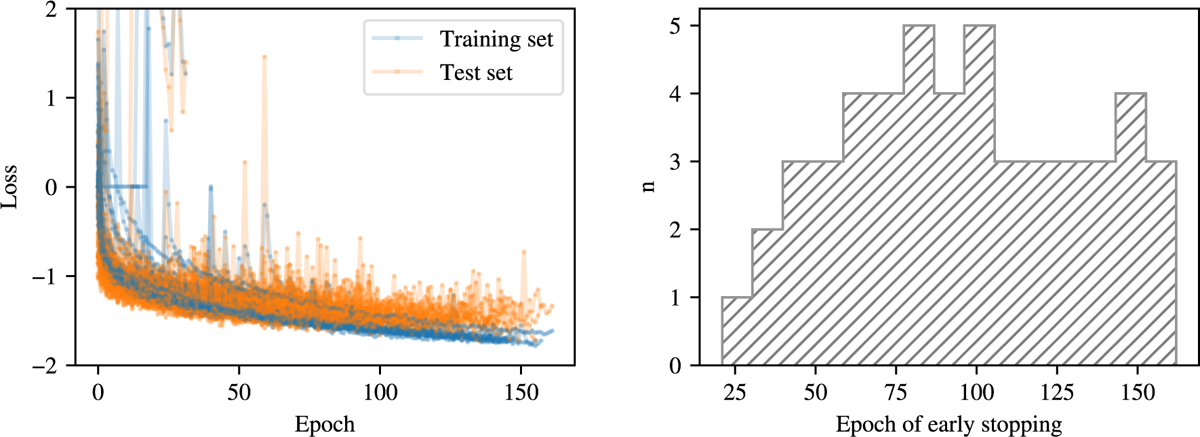
Training of the CNNs ensemble. Left panel: Training curves (loss function at each training epoch) of all the 50 CNNs of the final ensemble; for the blue lines the loss function is computed on the training set while the orange lines represent the results obtained on the test set. Right panel: Distribution of the number of epochs after which, monitoring the value of the loss function on the test set, the CNN training was early stopped.
Current usage metrics show cumulative count of Article Views (full-text article views including HTML views, PDF and ePub downloads, according to the available data) and Abstracts Views on Vision4Press platform.
Data correspond to usage on the plateform after 2015. The current usage metrics is available 48-96 hours after online publication and is updated daily on week days.
Initial download of the metrics may take a while.