Open Access
Fig. 13
Download original image
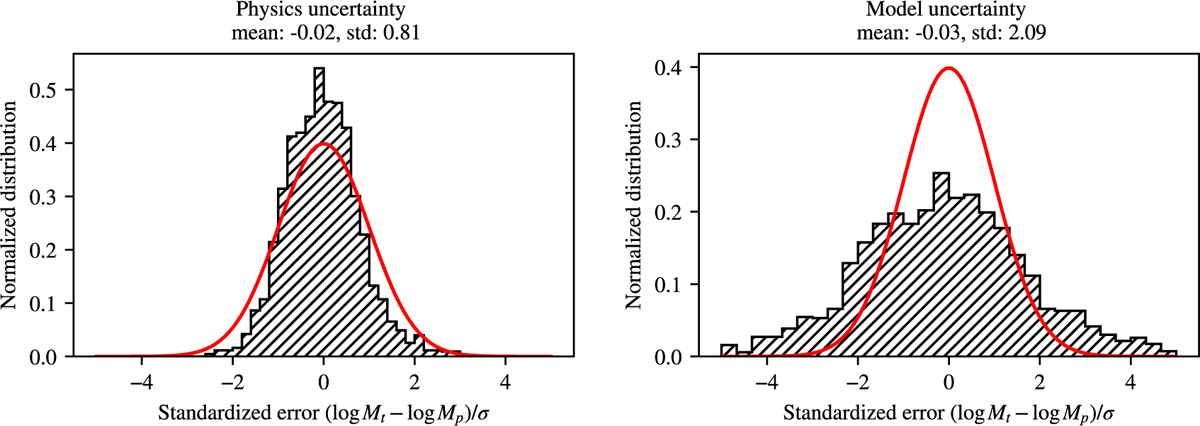
Comparison between the distributions of the standardized errors of DBNets mass estimates on the test set computed assuming, as the uncertainty, the physics (left panel) and model (right panel) contributions defined in Sect. 5.2, respectively. The red lines mark the expected Gaussian distributions of mean 0 and variance 1.
Current usage metrics show cumulative count of Article Views (full-text article views including HTML views, PDF and ePub downloads, according to the available data) and Abstracts Views on Vision4Press platform.
Data correspond to usage on the plateform after 2015. The current usage metrics is available 48-96 hours after online publication and is updated daily on week days.
Initial download of the metrics may take a while.