Fig. 12
Download original image
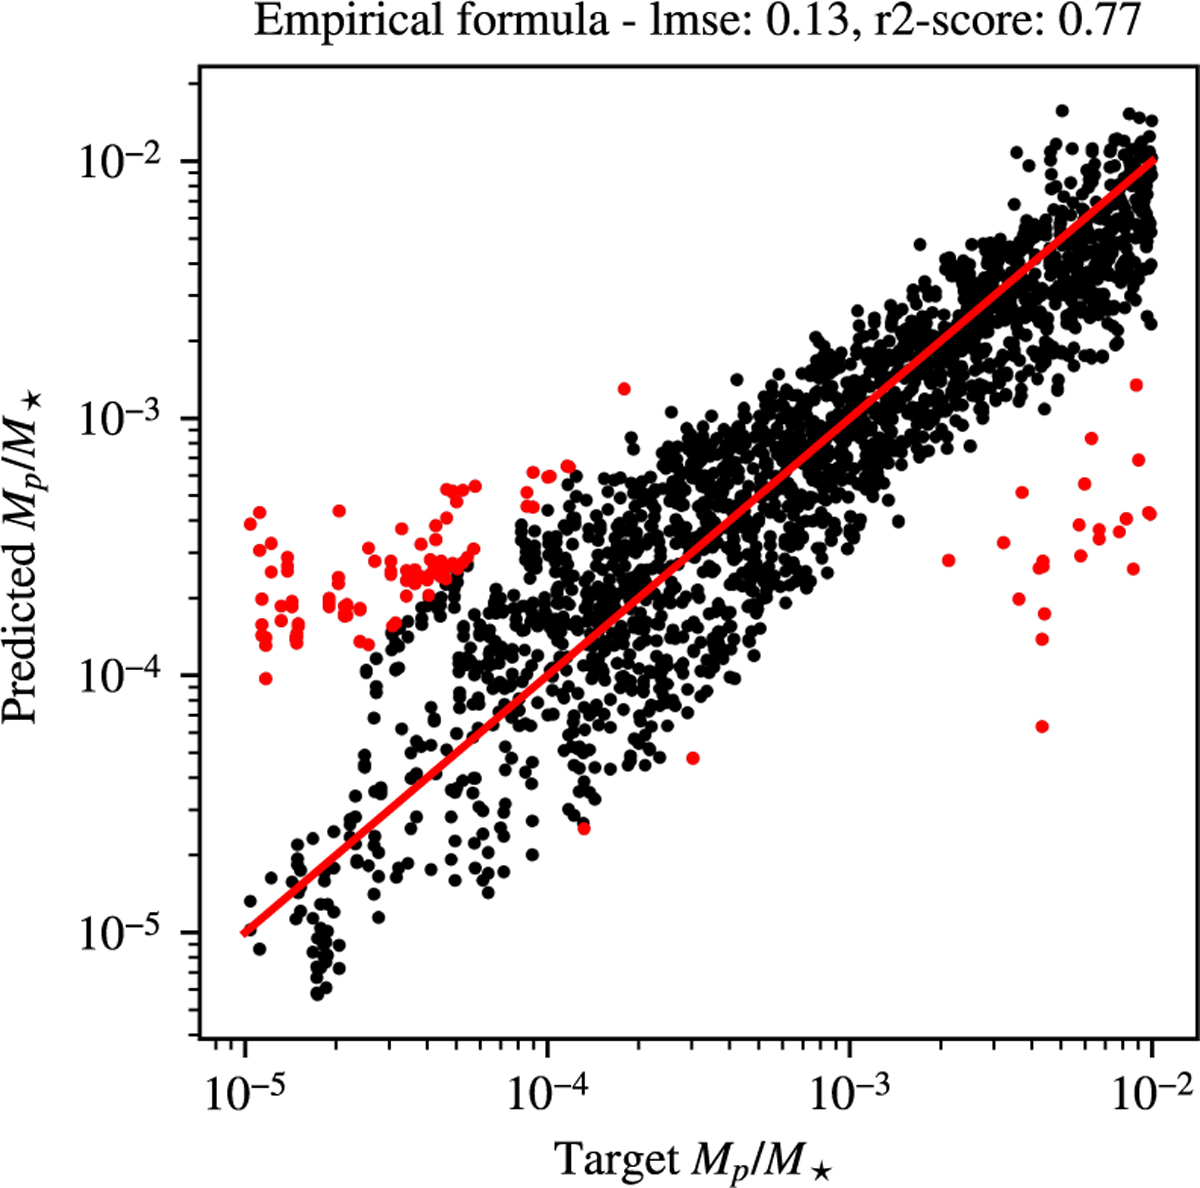
Results of the application on the entire dataset of the empirical formula Eq. (21). The scatter plot shows the correlation between the target planet mass and that estimated with Eq. (21). The red line marks the ideal exact correlation that is targeted. The evident outliers characterized by an error on the logarithm of the predicted planet mass greater than 0.7 dex are highlighted in red.
Current usage metrics show cumulative count of Article Views (full-text article views including HTML views, PDF and ePub downloads, according to the available data) and Abstracts Views on Vision4Press platform.
Data correspond to usage on the plateform after 2015. The current usage metrics is available 48-96 hours after online publication and is updated daily on week days.
Initial download of the metrics may take a while.