Fig. 6.
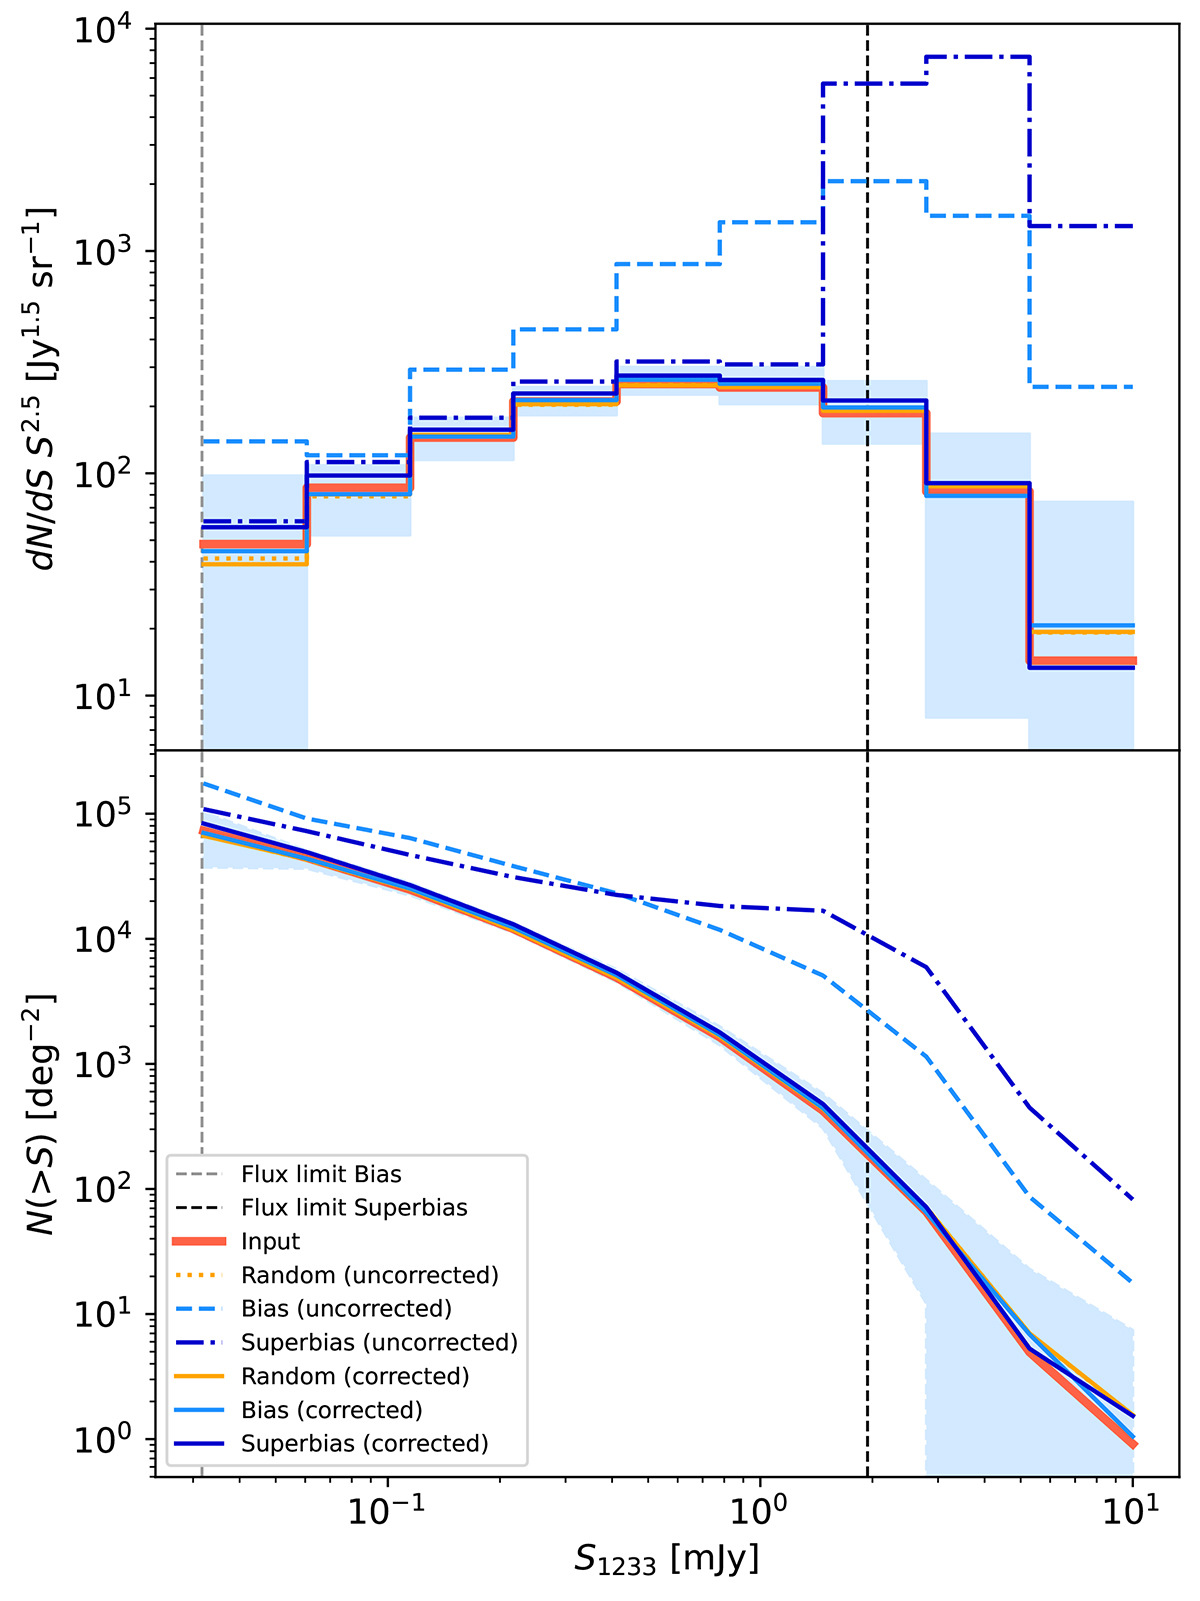
Download original image
Simulated differential (top) and cumulative (bottom) number counts for single pointings in ALMA Band 6 based on the SIDES simulated sky catalogue (Béthermin et al. 2017; Gkogkou et al. 2023), the pointing distribution of A3COSMOS, and our applied selection criteria. The coloured lines show the number counts for different simulated biases (see Sect. 3.3). Dark orange indicates the input number counts as inferred from the complete SIDES catalogue. Light orange is for the pointings randomly distributed on the sky (Random). Dark blue is for the pointings that target all the brightest sources (Superbias). Light blue is for the pointings that reflect the target source brightness distribution in A3COSMOS (Bias). The dashed, dash-dotted, and dotted lines are number counts inferred from the complete pointings; the solid lines show the number counts when applying a central mask of 1 arcsec and weighting by redshift proximity. The shaded region shows the 1σ dispersion between all realisations of the corrected Bias line, but is approximately equal for all corrected lines. The vertical black and grey dashed lines indicate the flux density of the faintest target source in the Superbias and Bias cases, respectively. We note that the uncorrected Random line is not visible in the lower panel, as it fully agrees with the corrected Random line.
Current usage metrics show cumulative count of Article Views (full-text article views including HTML views, PDF and ePub downloads, according to the available data) and Abstracts Views on Vision4Press platform.
Data correspond to usage on the plateform after 2015. The current usage metrics is available 48-96 hours after online publication and is updated daily on week days.
Initial download of the metrics may take a while.