Fig. 2.
Download original image
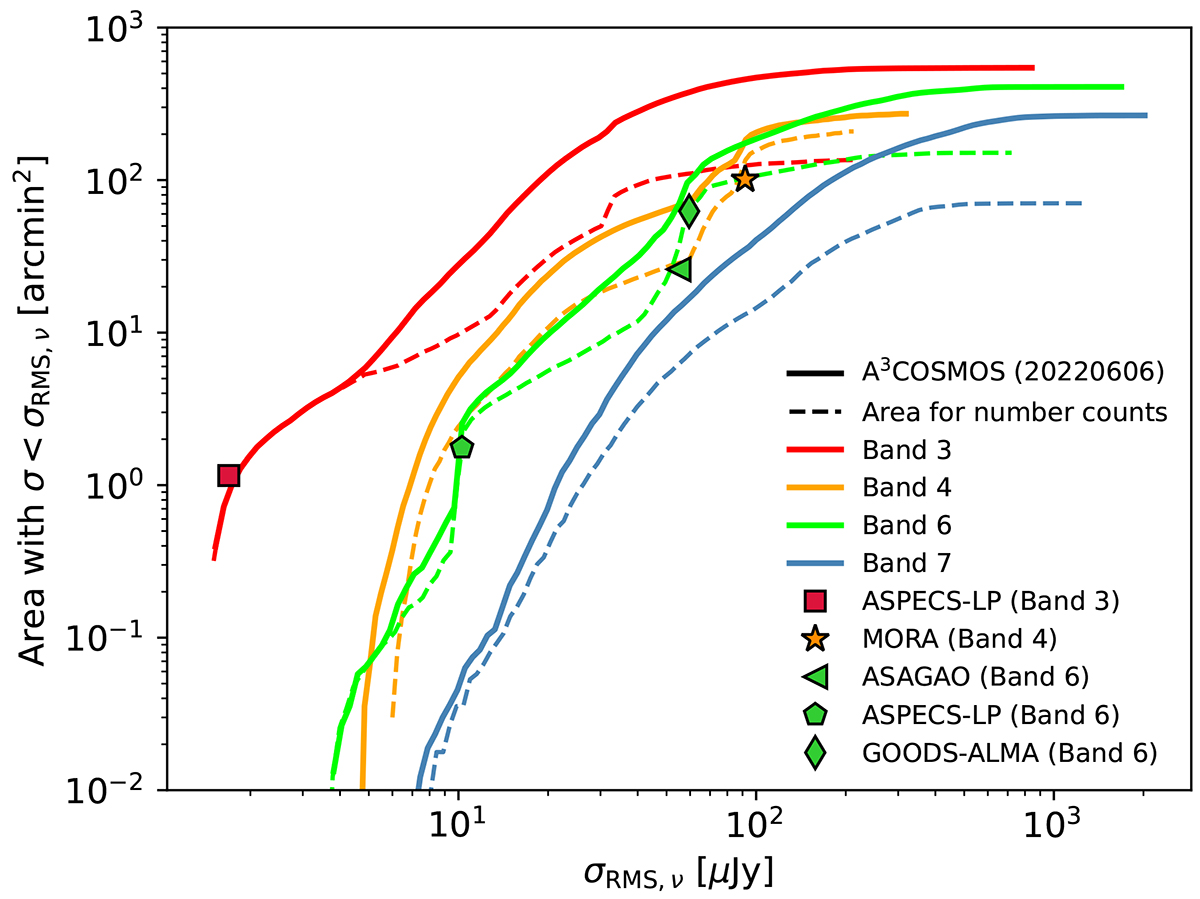
Cumulative areal coverage of the A3COSMOS database, version 20220606, as a function of 1σRMS sensitivity for ALMA Bands 3, 4, 6, and 7. The noise of all images in each band is normalised to the central wavelength of the band, and spatial overlaps of images are accounted for. The solid lines indicate an entire database; the image areas are considered out to a primary beam attenuation of 0.2. The dashed lines are images selected for the computation of the number counts after masking out the phase centres and cropping the edges at a primary beam attenuation of 0.3 (see Sect. 3.1). The symbols (see legend) represent the area and normalised depth of multiple ALMA blind surveys: ASPECS-LP (González-López et al. 2019, 2020), MORA (Zavala et al. 2021; Casey et al. 2021), ASAGAO (Hatsukade et al. 2018), and GOODS-ALMA (Gómez-Guijarro et al. 2022).
Current usage metrics show cumulative count of Article Views (full-text article views including HTML views, PDF and ePub downloads, according to the available data) and Abstracts Views on Vision4Press platform.
Data correspond to usage on the plateform after 2015. The current usage metrics is available 48-96 hours after online publication and is updated daily on week days.
Initial download of the metrics may take a while.