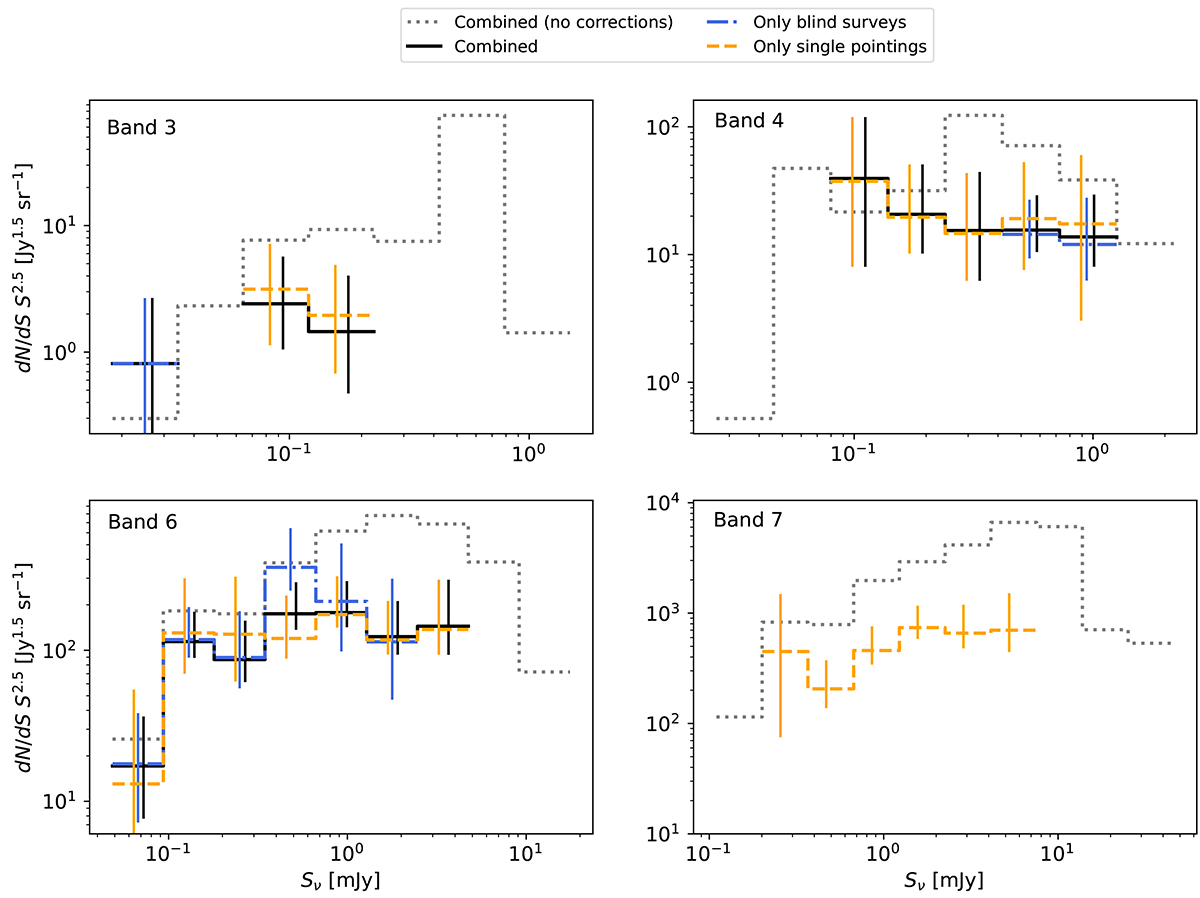
Fig. E.1.
Download original image
Differential continuum number counts computed from the A3COSMOS database in four ALMA bands (as labelled in the top left corner of each panel). The number counts are measured for four different sets of data. The grey dotted line indicates use of all images and blindly extracted sources contained within the entire database, applying no selection or correction; the blue dash-dotted line is for the use of images only from ALMA blind surveys and sources found therein; the orange dashed line is for the use of only precisely targeted single pointings, after masking out a central circular region of 1 arcsec (4 arcsec in Band 7) radius and weighting the contribution of each detected source outside the masked region by the proximity of its redshift to that of the respective target (see Sect. 3.1); the black solid line is for both blind surveys and single pointings with targets, after masking the phase centre and weighting sources by redshift. As the single pointing line overlaps with other lines in several bins, it has been slightly shifted to improve visibility. In Band 3, it is increased by 5%, in Band 4 and 6 it is lowered by 5%. Error bars are shown for each bin of all lines except the uncorrected case, in the colour of the respective line. No blind surveys exist in our database for Band 7, and therefore no number counts are shown for that and the combined case.
Current usage metrics show cumulative count of Article Views (full-text article views including HTML views, PDF and ePub downloads, according to the available data) and Abstracts Views on Vision4Press platform.
Data correspond to usage on the plateform after 2015. The current usage metrics is available 48-96 hours after online publication and is updated daily on week days.
Initial download of the metrics may take a while.