Open Access
Fig. C.1.
Download original image
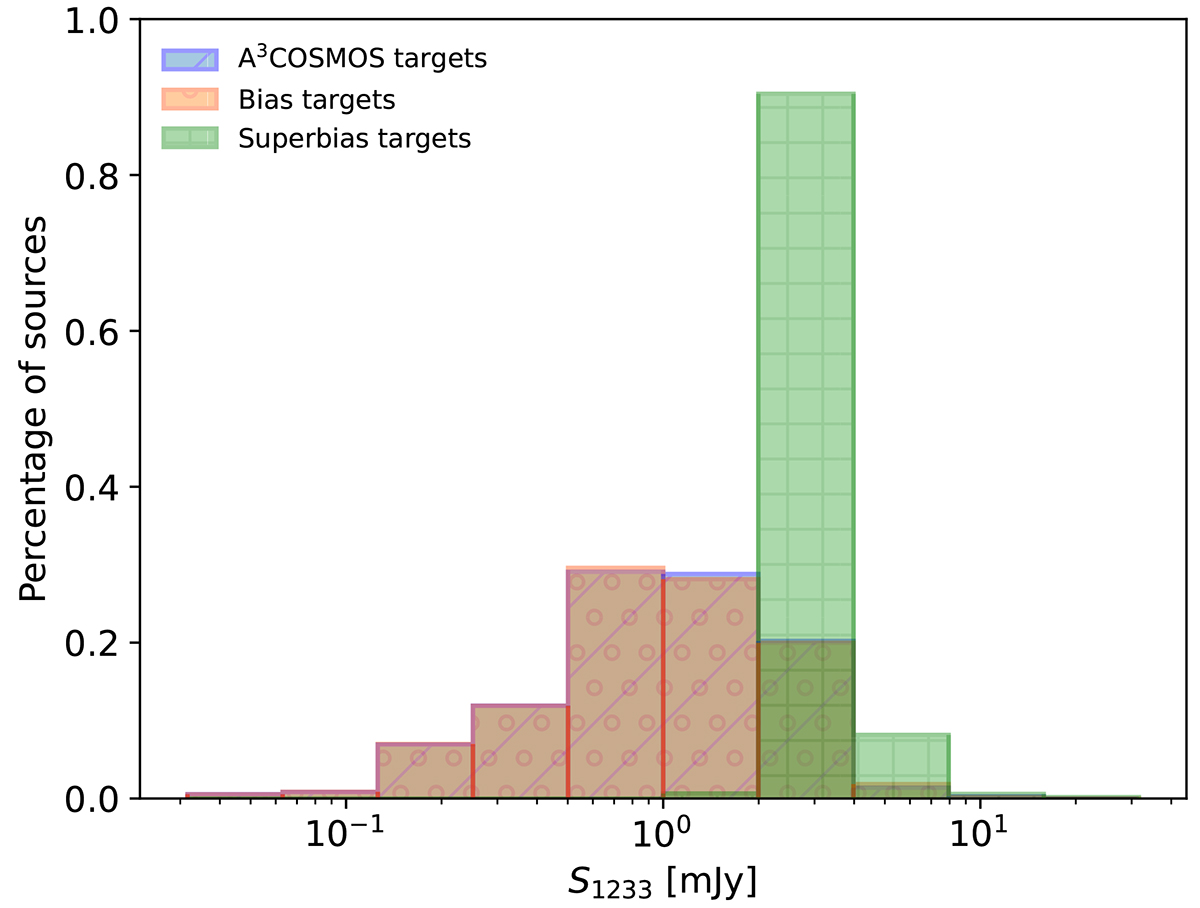
Band 6 flux density distribution of targets in the simulation compared to the real targets of precisely targeted pointings in the A3COSMOS database. Orange with circles indicates Bias mode; green with squares is Superbias mode; and blue with diagonal lines is for real targets.
Current usage metrics show cumulative count of Article Views (full-text article views including HTML views, PDF and ePub downloads, according to the available data) and Abstracts Views on Vision4Press platform.
Data correspond to usage on the plateform after 2015. The current usage metrics is available 48-96 hours after online publication and is updated daily on week days.
Initial download of the metrics may take a while.