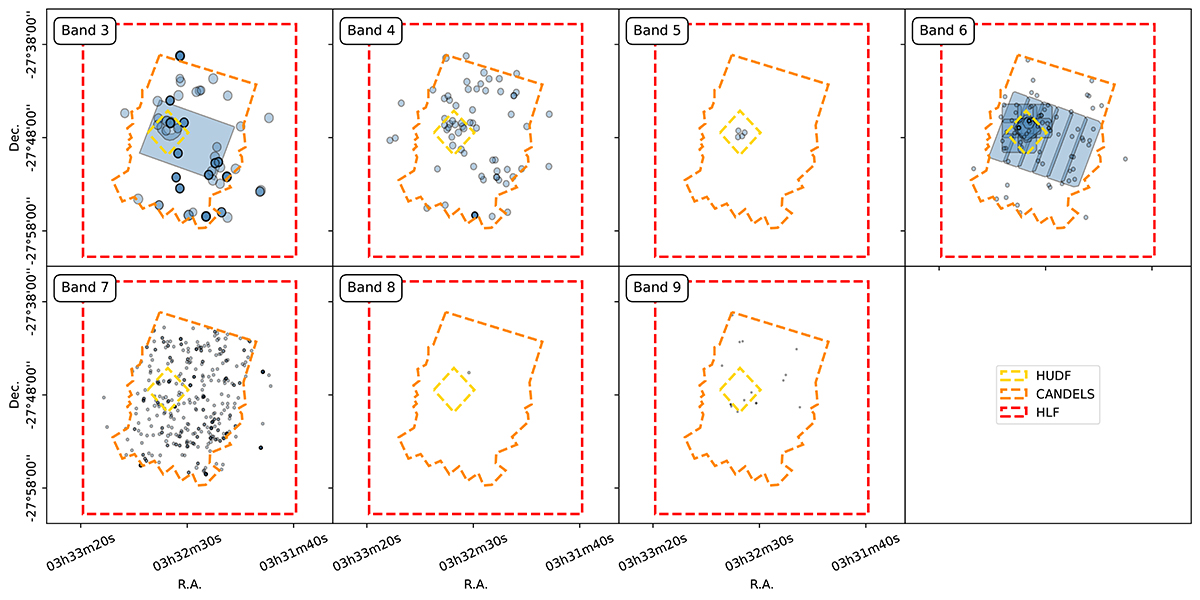
Fig. B.2.
Download original image
Spatial sky coverage of A3GOODSS as shown in the bottom panel of Fig. 1, and split into individual ALMA bands, as indicated in the top left of each panel. The dashed coloured lines indicate the approximate outlines of the Hubble Ultra Deep Field (yellow; Beckwith et al. 2006), CANDELS (orange; as in Guo et al. 2013), and Hubble Legacy Fields (red; Illingworth et al. 2016).
Current usage metrics show cumulative count of Article Views (full-text article views including HTML views, PDF and ePub downloads, according to the available data) and Abstracts Views on Vision4Press platform.
Data correspond to usage on the plateform after 2015. The current usage metrics is available 48-96 hours after online publication and is updated daily on week days.
Initial download of the metrics may take a while.