Fig. 1.
Download original image
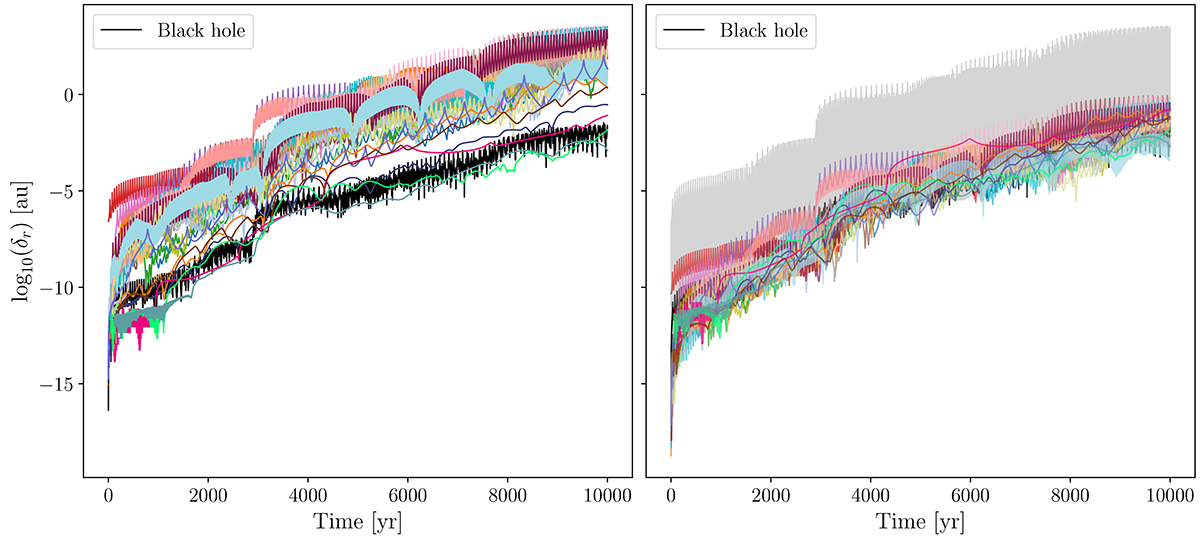
Position-space separations as a function of time before and after reducing the spread in the curves. Left: Time evolution of separation in position space for each S-star and the central black hole. Right: y = −0.00018446 ⋅ a/au + log(e)+4.3103 subtracted from the time evolution of log10(δr) for each S-star. The grey shading shows the region between the non-reduced maxima and minima of δr over the whole system at each time step, indicating the magnitude of reduction in the spread of the curves, although its lower section is obscured by the coloured curves.
Current usage metrics show cumulative count of Article Views (full-text article views including HTML views, PDF and ePub downloads, according to the available data) and Abstracts Views on Vision4Press platform.
Data correspond to usage on the plateform after 2015. The current usage metrics is available 48-96 hours after online publication and is updated daily on week days.
Initial download of the metrics may take a while.