Fig. F.1.

Download original image
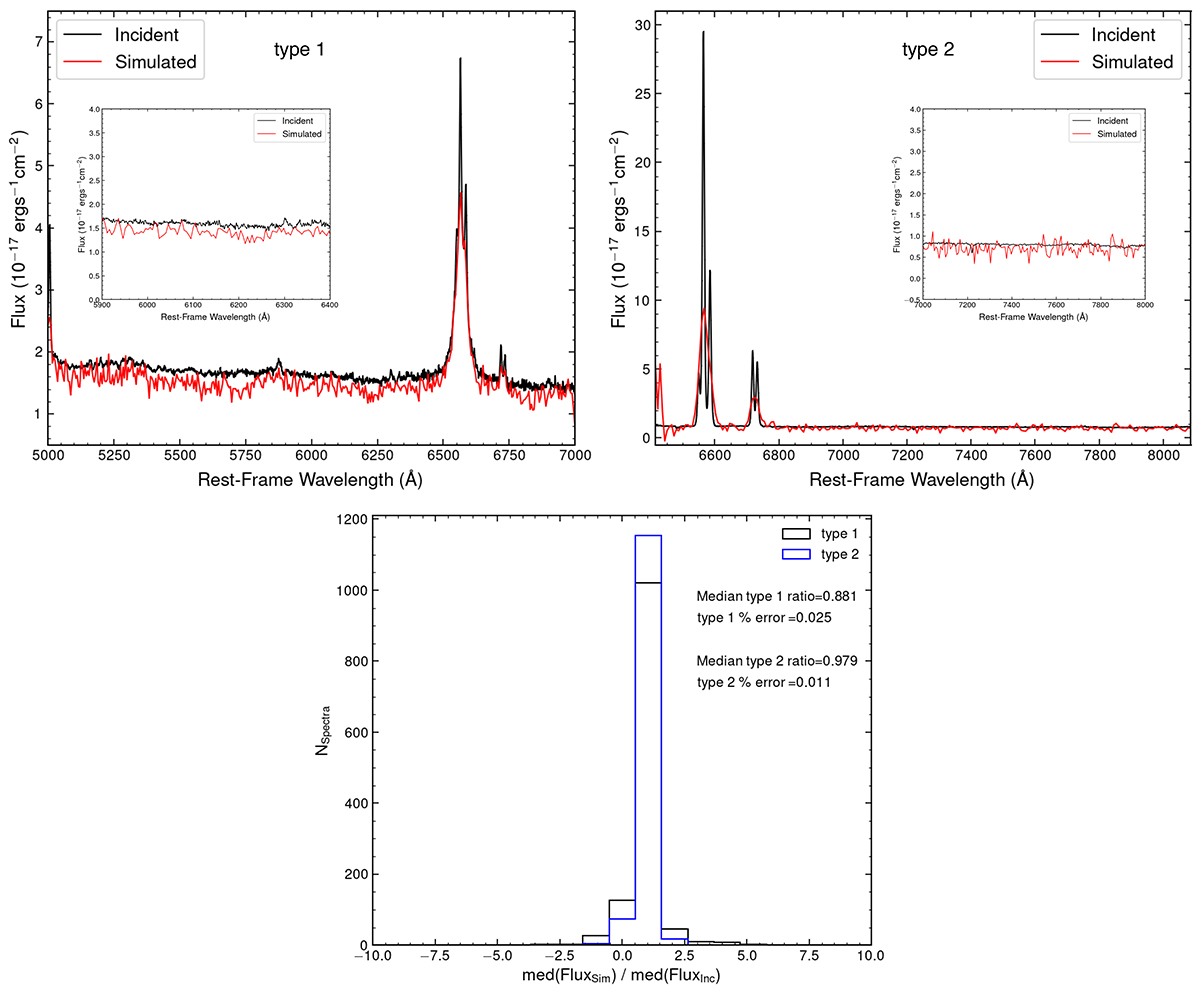
Top row: Example of a comparison between the incident (black) and simulated (red) spectra for a type 1 (left) and a type 2 (right) AGN around the Hα region. The inset plot is a zoom-in of a continuum (emission line free) region. Bottom row: distribution of the ratios of the median flux value (i.e., the median of the observed flux of the total spectrum) of the incident and simulated data for both type 1 (black) and type 2 (blue) AGN. The median values for the two distributions are also reported. The percentage error on the distributions of the spectrum flux median values are computed as ![]() , where σ and N represent the standard dispersion of the distribution and the number of objects, respectively.
, where σ and N represent the standard dispersion of the distribution and the number of objects, respectively.
Current usage metrics show cumulative count of Article Views (full-text article views including HTML views, PDF and ePub downloads, according to the available data) and Abstracts Views on Vision4Press platform.
Data correspond to usage on the plateform after 2015. The current usage metrics is available 48-96 hours after online publication and is updated daily on week days.
Initial download of the metrics may take a while.


