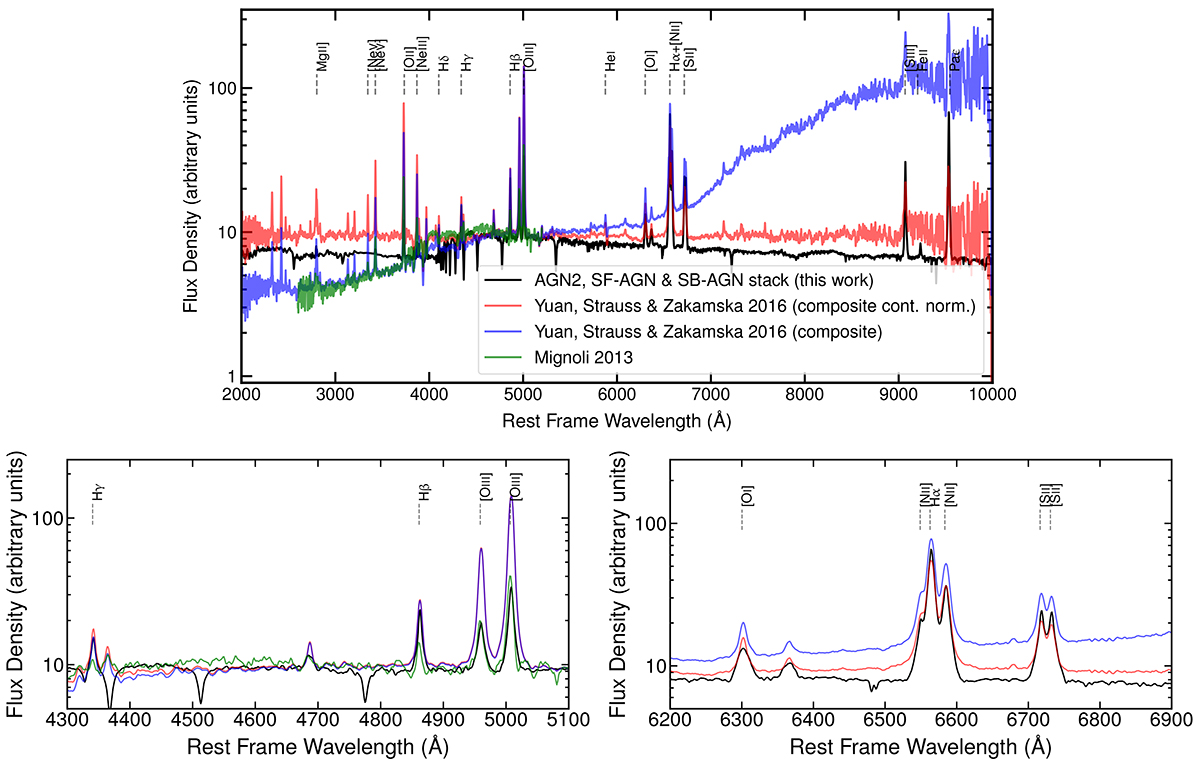
Fig. E.1.
Download original image
Comparison of the semi-empirical template incident spectra of type 2 AGN utilised in this work (shown with the black solid line) with the empirical one published by Yuan et al. (2016). The blue line represents the composite spectrum of all BOSS type 2 quasars in the sample analysed by Yuan et al. (2016), whilst the red line is derived by normalising the composite spectrum to a continuum obtained by spline-interpolating between relatively line-free regions. The green line represents the spectral stack of 94 narrow-line AGN published by Mignoli et al. (2013). For sake of comparison, the literature composites are normalised at the 5100 Å flux of our stack. Main emission lines are marked. The bottom panels are two zoom-ins around the Hβ (left) and the Hα (right) the spectral regions. Stellar absorption features are also included and visible in our type 2 AGN spectrum between Hγ and Hβ (see also Fig. A1 by Vidal-García et al. 2017 and Figs. 9 e 10 by Bruzual & Charlot 2003), which will be blended to the continuum in any moderate (low) resolution spectrum.
Current usage metrics show cumulative count of Article Views (full-text article views including HTML views, PDF and ePub downloads, according to the available data) and Abstracts Views on Vision4Press platform.
Data correspond to usage on the plateform after 2015. The current usage metrics is available 48-96 hours after online publication and is updated daily on week days.
Initial download of the metrics may take a while.