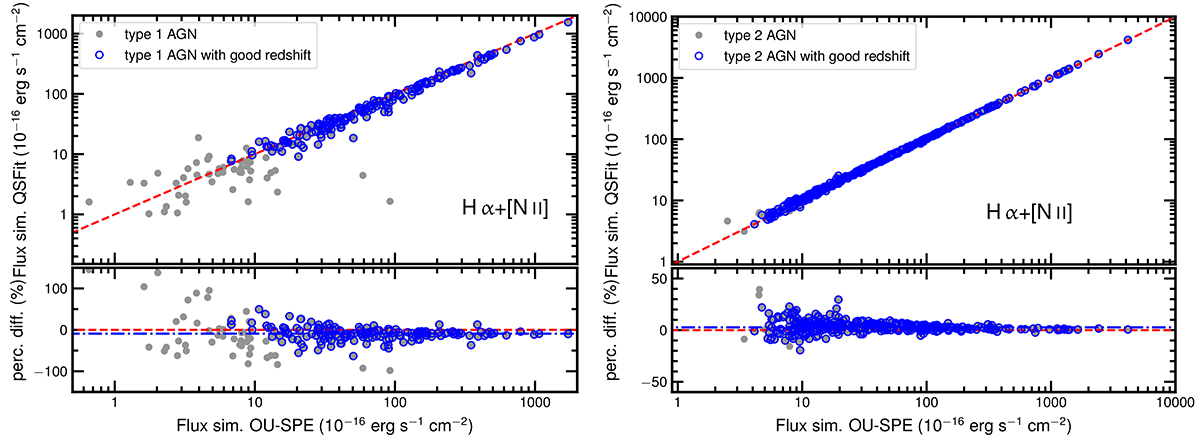
Fig. C.1.
Download original image
Comparison of the Hα+[N II] flux measurements of the simulated spectra between QSFIT and OU-SPE. The results for the type 1 and type 2 AGN are shown in the left and right panels, respectively. Sources with a spectroscopic redshift measured from the simulated spectra and flagged as good (see Sect. 5 for details) are marked with blue symbols. The bottom panel shows the percentage flux difference defined as ΔF/F = (FHα, QSFIT − FHα, OU − SPE)/FHα, OU − SPE. The one-to-one flux relation is shown with a red dashed line, which is set to zero in the bottom panel. The dot-dashed blue line in the bottom panel represents the 50th percentile of the ΔF/F distribution.
Current usage metrics show cumulative count of Article Views (full-text article views including HTML views, PDF and ePub downloads, according to the available data) and Abstracts Views on Vision4Press platform.
Data correspond to usage on the plateform after 2015. The current usage metrics is available 48-96 hours after online publication and is updated daily on week days.
Initial download of the metrics may take a while.