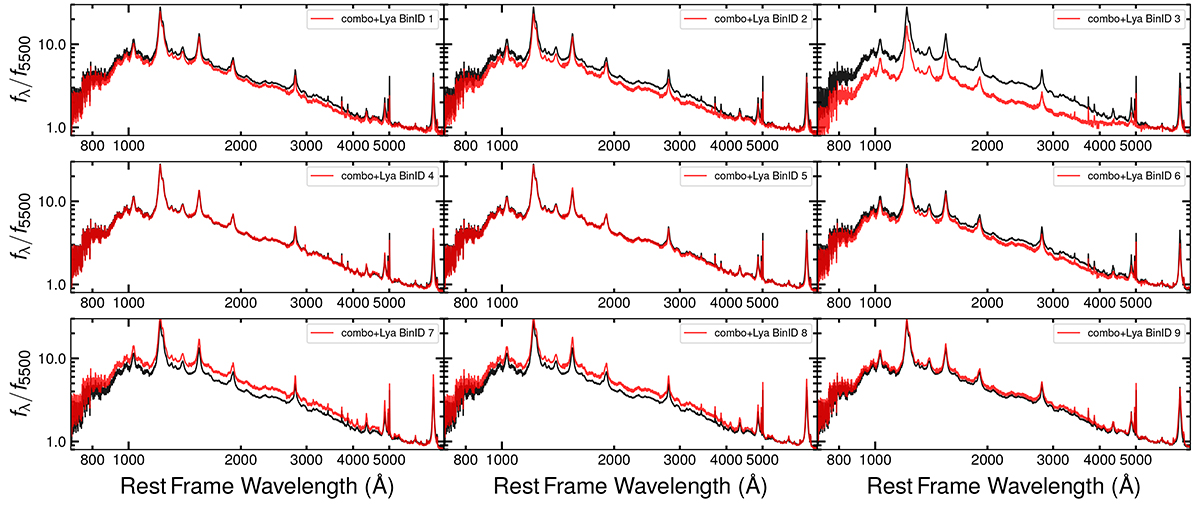
Fig. 2.
Download original image
Composite spectra from ultraviolet to optical rest frame wavelengths. The black line represents the stack obtained from the entire sample, shown as a reference. The red lines in the different panels represent the final stack in each bin from the combined composites from blueward of Lyα to Hα. The combined spectra covers the rest-frame wavelength interval 800–7000 Å. The spectral flattening at wavelengths longer than 4000 Å is likely due to the contribution of the host galaxy emission.
Current usage metrics show cumulative count of Article Views (full-text article views including HTML views, PDF and ePub downloads, according to the available data) and Abstracts Views on Vision4Press platform.
Data correspond to usage on the plateform after 2015. The current usage metrics is available 48-96 hours after online publication and is updated daily on week days.
Initial download of the metrics may take a while.