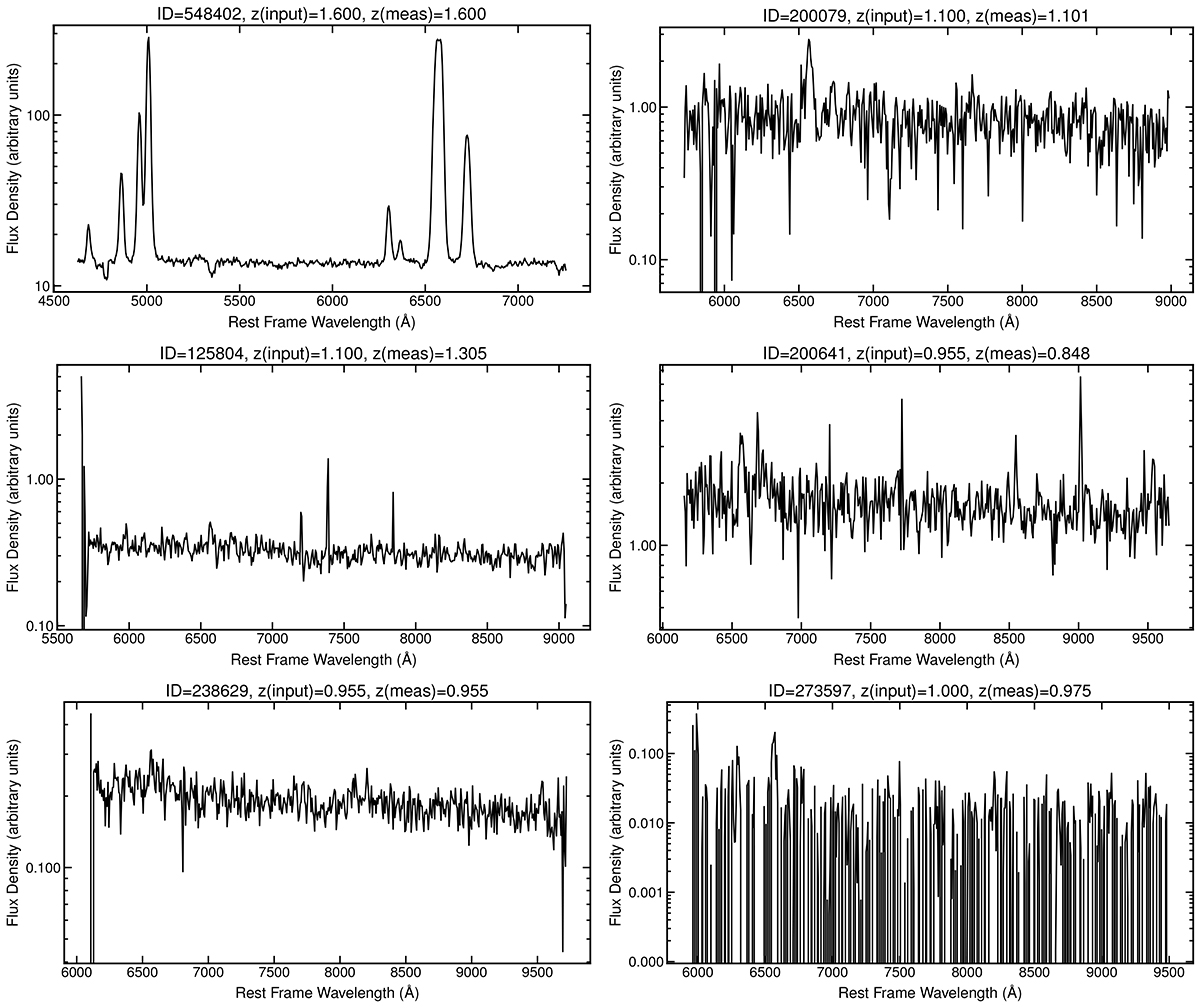
Fig. A.2.
Download original image
Example of Euclid-like simulated spectra for type 2 AGN in the redshift interval 0.89 ≤ z ≤ 1.83, thus where the Hα complex is within the spectral coverage of the red grism. Spectra are shown at different S/N and noise levels (medium/high on the left and low on the right) for the good (top row), false (mid row), and lost (bottom row) redshift classes (see Sect. 5).
Current usage metrics show cumulative count of Article Views (full-text article views including HTML views, PDF and ePub downloads, according to the available data) and Abstracts Views on Vision4Press platform.
Data correspond to usage on the plateform after 2015. The current usage metrics is available 48-96 hours after online publication and is updated daily on week days.
Initial download of the metrics may take a while.