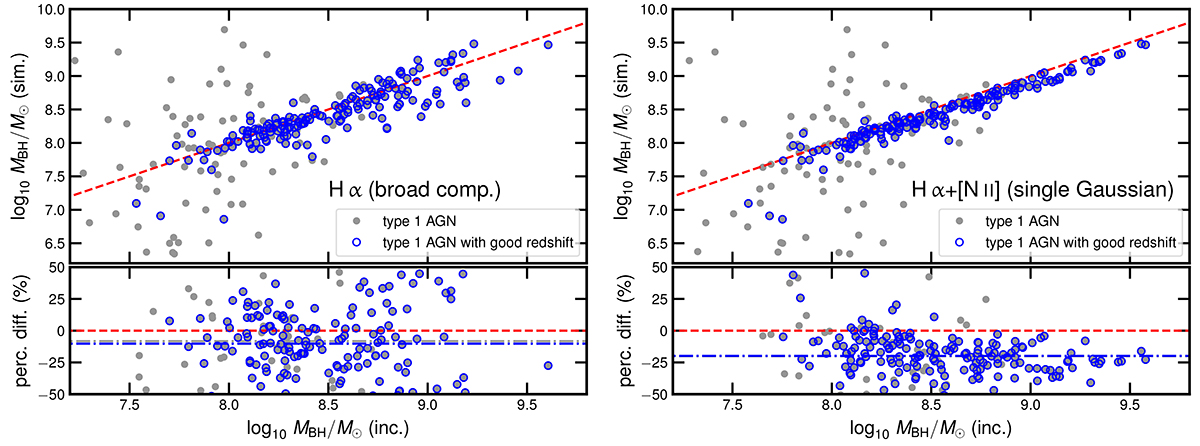
Fig. 16.
Download original image
Comparison of MBH estimates between incident and simulated data derived from the Hα (see Sect. 7.3 for details). Left panel: MBH derived from the best fit of the incident data that considers only the broad component of the Hα emission line profile (see Sect. 6.1). Right panel: MBH derived from the best fit of the incident data that considers one single Gaussian component of the Hα emission line profile (see Sect. 7.1). Symbols are as in Fig. 11.
Current usage metrics show cumulative count of Article Views (full-text article views including HTML views, PDF and ePub downloads, according to the available data) and Abstracts Views on Vision4Press platform.
Data correspond to usage on the plateform after 2015. The current usage metrics is available 48-96 hours after online publication and is updated daily on week days.
Initial download of the metrics may take a while.