Fig. 13.
Download original image
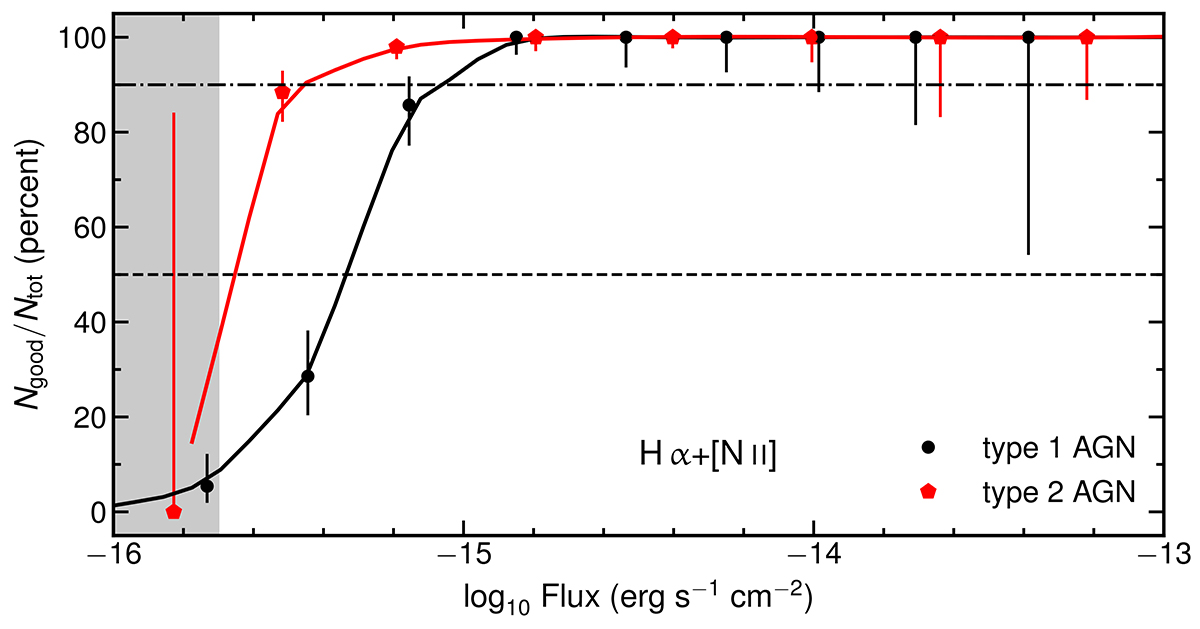
Ratio between the number of sources with a ‘good’ redshift measurement (see Sect. 5 for details) and the total number of objects (in percent) as a function of the integrated flux of the observed Hα+[N II] emission complex in the simulated spectra for type 1 (black filled symbols) and type 2 (red pentagons) AGN. The dashed and dot-dashed lines mark the 50th and 90th percentiles, respectively.
Current usage metrics show cumulative count of Article Views (full-text article views including HTML views, PDF and ePub downloads, according to the available data) and Abstracts Views on Vision4Press platform.
Data correspond to usage on the plateform after 2015. The current usage metrics is available 48-96 hours after online publication and is updated daily on week days.
Initial download of the metrics may take a while.