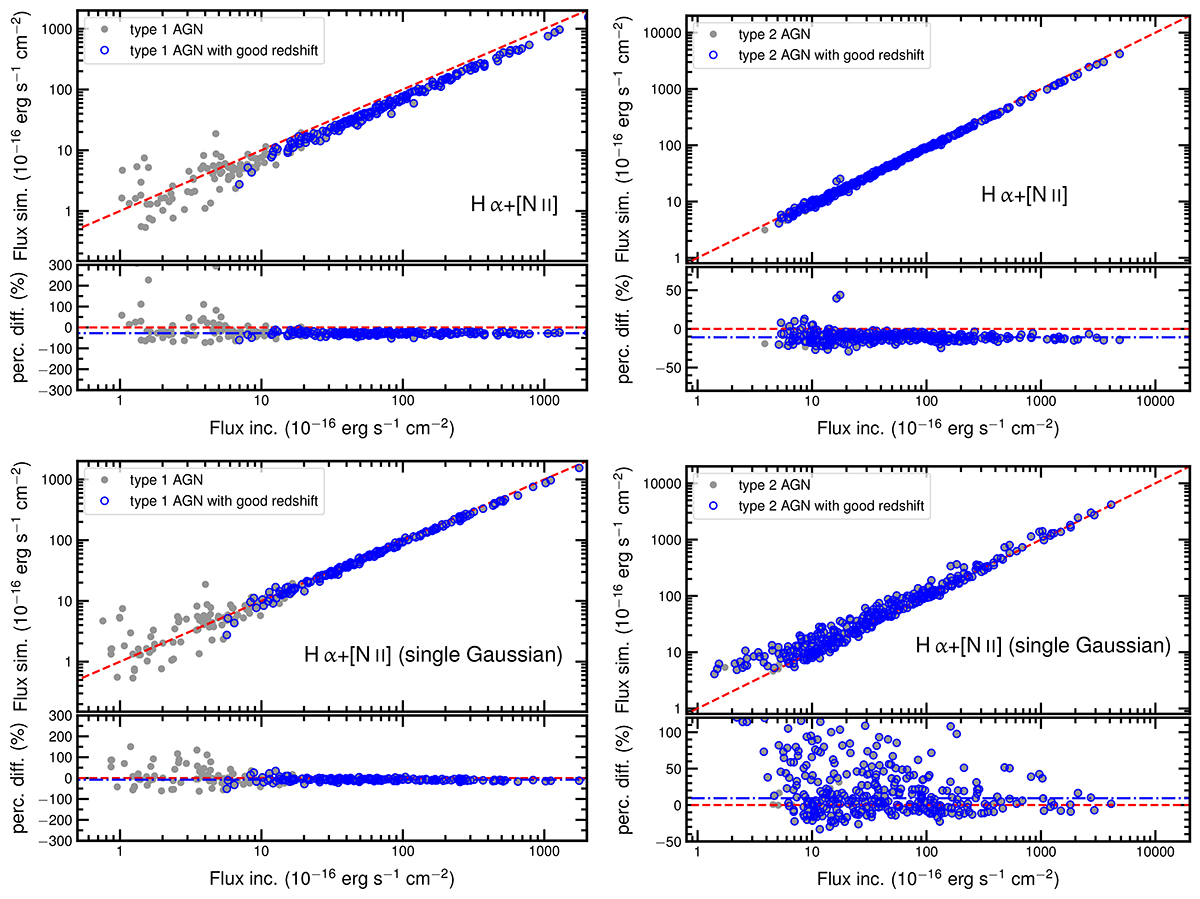
Fig. 11.
Download original image
Comparison of the Hα+[N II] flux measurement between the simulated and the incident spectra for the type 1 (left) and type 2 (right) AGN samples. Sources with a spectroscopic redshift measured from the simulated spectra and flagged as ‘good’ (see Sect. 5 for details) are marked with blue symbols. The bottom panel in each plot shows the percentage luminosity difference defined as ΔF/F = (FHα, sim − FHα, inc)/FHα, inc. The one-to-one flux relation is shown with a red dashed line, which is set to zero in the bottom panel. The dot-dashed blue line in the bottom panel represents the 50th percentile of the ΔF/F distribution. Top row: Simulated data: best fit flux obtained from the integration of a single broad component used to model the Hα+[N II] complex. Incident: Best fit flux obtained from the summation of the individual components used to model the Hα+[N II] complex for incident spectra (i.e., broad and narrow component for the Hα, [N II]λλ6549, 6583). Bottom row: The best fit flux of the Hα+[N II] complex is obtained from the integration of a single broad component for both simulated and incident data.
Current usage metrics show cumulative count of Article Views (full-text article views including HTML views, PDF and ePub downloads, according to the available data) and Abstracts Views on Vision4Press platform.
Data correspond to usage on the plateform after 2015. The current usage metrics is available 48-96 hours after online publication and is updated daily on week days.
Initial download of the metrics may take a while.