Open Access
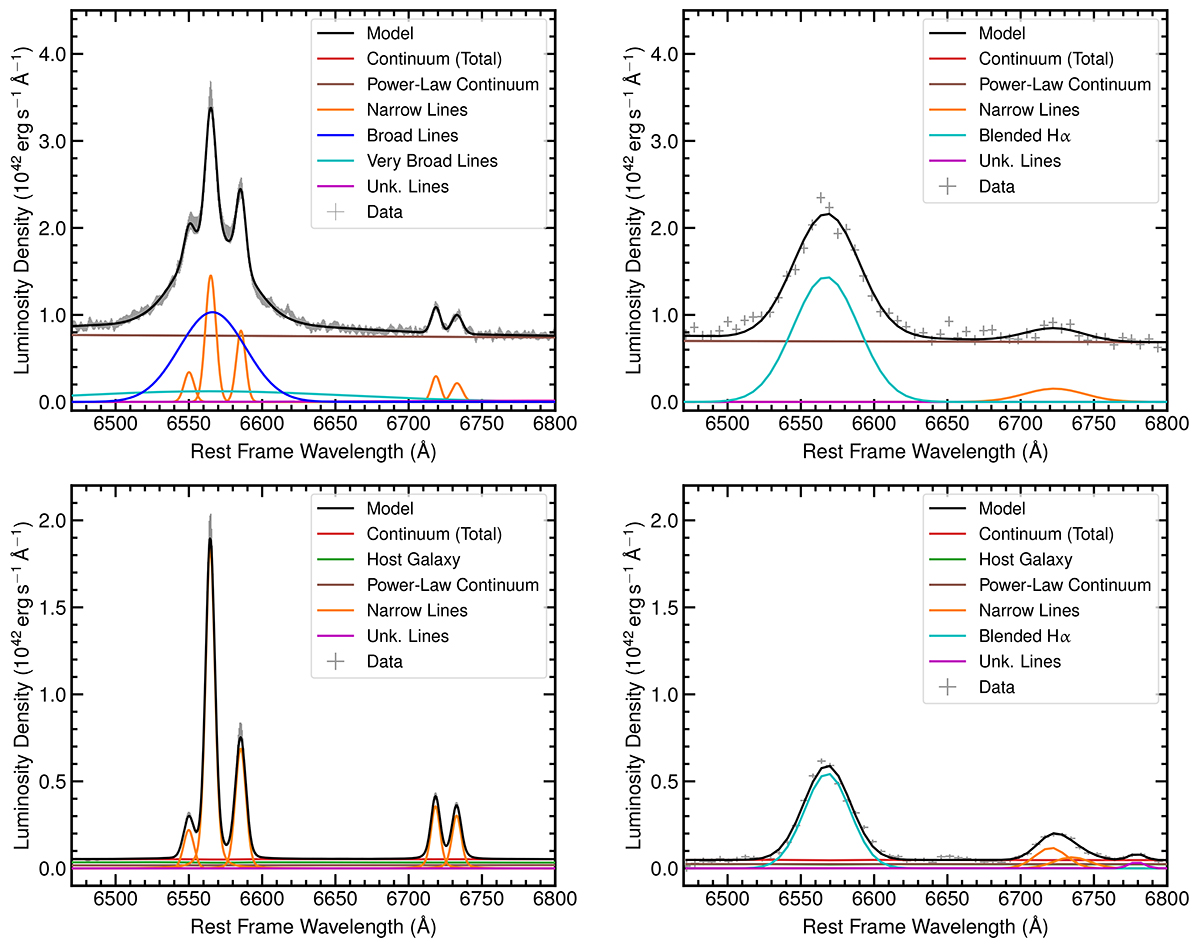
Fig. 10.
Download original image
Example showing type 1 (top row) and type 2 (bottom row) AGN Hα complex of incident (left) and Euclid-like simulated spectra (right). The sources shown in this plot have redshifts z = 1.7 (type 1) and z = 1.2 (type 2).
Current usage metrics show cumulative count of Article Views (full-text article views including HTML views, PDF and ePub downloads, according to the available data) and Abstracts Views on Vision4Press platform.
Data correspond to usage on the plateform after 2015. The current usage metrics is available 48-96 hours after online publication and is updated daily on week days.
Initial download of the metrics may take a while.