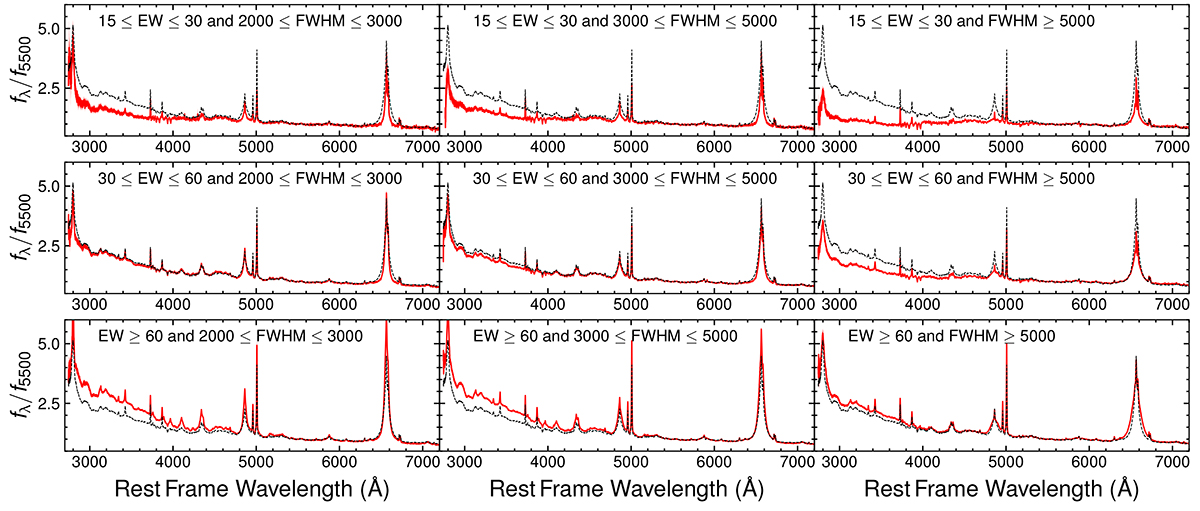
Fig. 1.
Download original image
Composite spectra of the low-z sample from ultraviolet to optical rest frame wavelengths. Black line: Stack obtained from the entire sample, shown as a reference. The different composites (shown with the red lines) obtained in each bin are marked as in Table 1 and are shown in separate panels. EW and FWHM are relative to the Hβ emission line and are in units of Å and km s−1, respectively.
Current usage metrics show cumulative count of Article Views (full-text article views including HTML views, PDF and ePub downloads, according to the available data) and Abstracts Views on Vision4Press platform.
Data correspond to usage on the plateform after 2015. The current usage metrics is available 48-96 hours after online publication and is updated daily on week days.
Initial download of the metrics may take a while.