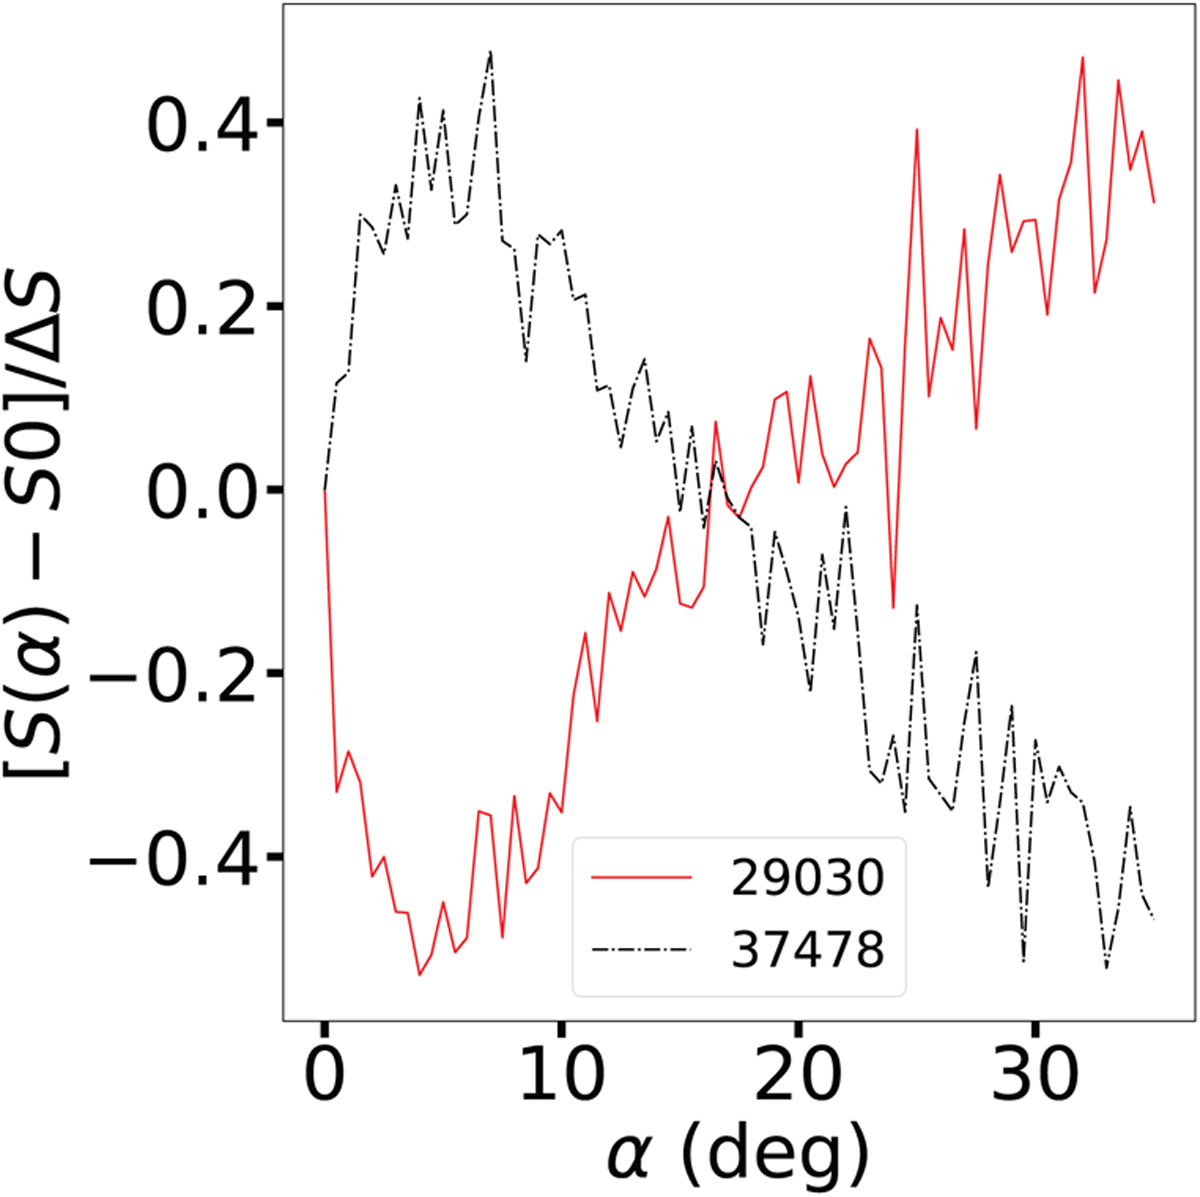
Fig. 7
Download original image
Change in the spectral slope relative to the slope at α = 0 deg and normalized to its maximum amplitude to increase contrast using the full P(Hλ). With the continuous red line, we show the curve for 29030, whose colors might mean that it is an S-complex asteroid, see below, and with the dot-dashed black line, we show the curve for 37478, a possible C-complex asteroid according to its colors.
Current usage metrics show cumulative count of Article Views (full-text article views including HTML views, PDF and ePub downloads, according to the available data) and Abstracts Views on Vision4Press platform.
Data correspond to usage on the plateform after 2015. The current usage metrics is available 48-96 hours after online publication and is updated daily on week days.
Initial download of the metrics may take a while.