Fig. 6
Download original image
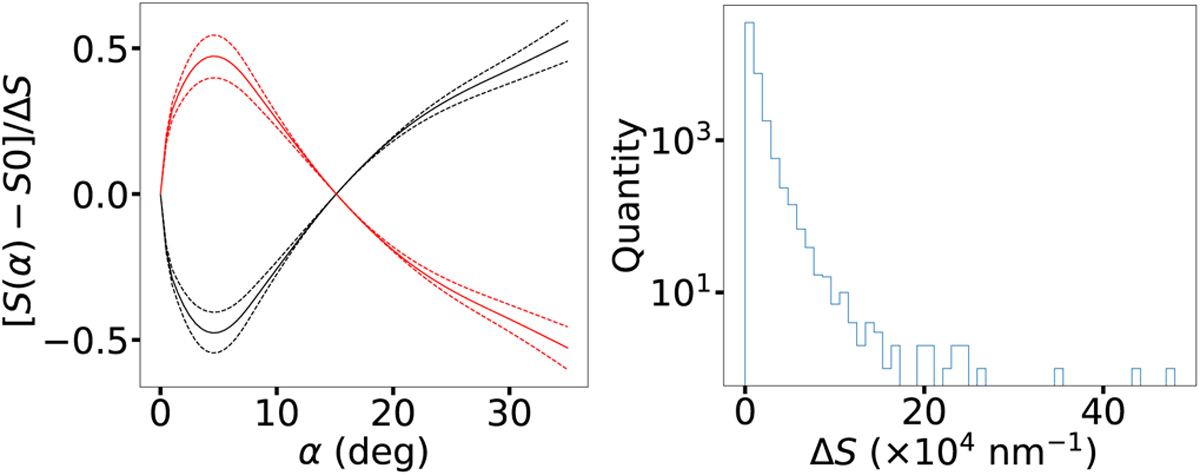
Two behaviors of the spectral slope. Left: change in the spectral slope relative to the slope at α = 0 deg and normalized to its maximum amplitude to increase contrast. The continuous line shows the average value of all objects with that behavior, and the dashed lines indicate the maximum and minimum values per α bin. Right: distribution of ∆S.
Current usage metrics show cumulative count of Article Views (full-text article views including HTML views, PDF and ePub downloads, according to the available data) and Abstracts Views on Vision4Press platform.
Data correspond to usage on the plateform after 2015. The current usage metrics is available 48-96 hours after online publication and is updated daily on week days.
Initial download of the metrics may take a while.