Open Access
Fig. 5
Download original image
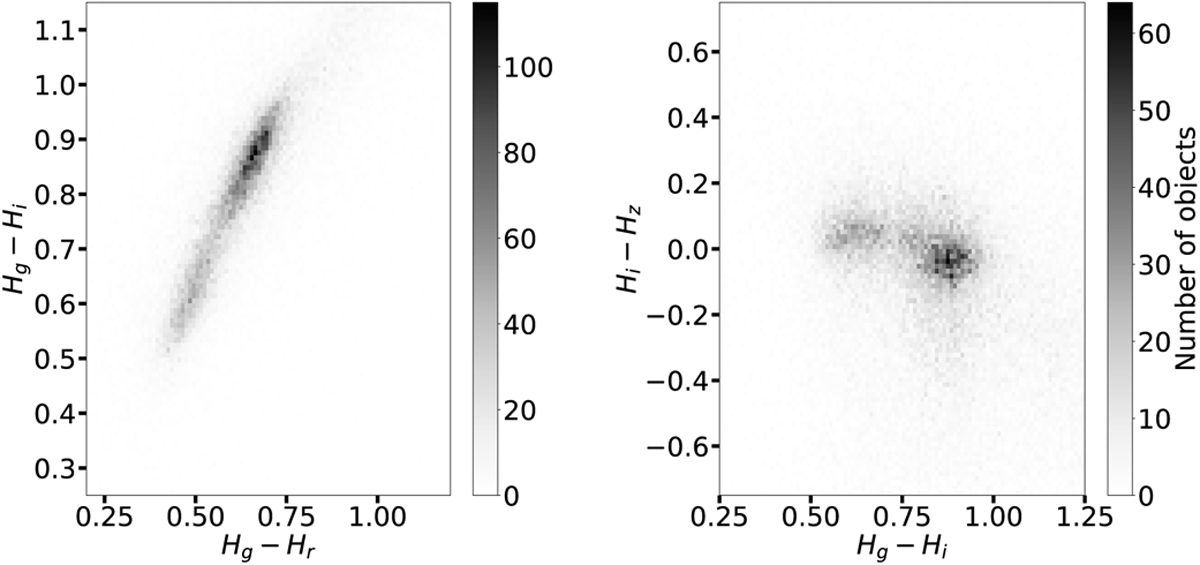
Color–color diagrams in the form of density plots. The left panel shows H𝑔 − Hr vs. H𝑔− Hi, highlighting the linear part of the spectrum, and the right panel shows the H𝑔 − Hi vs. Hi − Hɀ, doing the same for the region that encompasses the 900 nm absorption feature due to silicates.
Current usage metrics show cumulative count of Article Views (full-text article views including HTML views, PDF and ePub downloads, according to the available data) and Abstracts Views on Vision4Press platform.
Data correspond to usage on the plateform after 2015. The current usage metrics is available 48-96 hours after online publication and is updated daily on week days.
Initial download of the metrics may take a while.