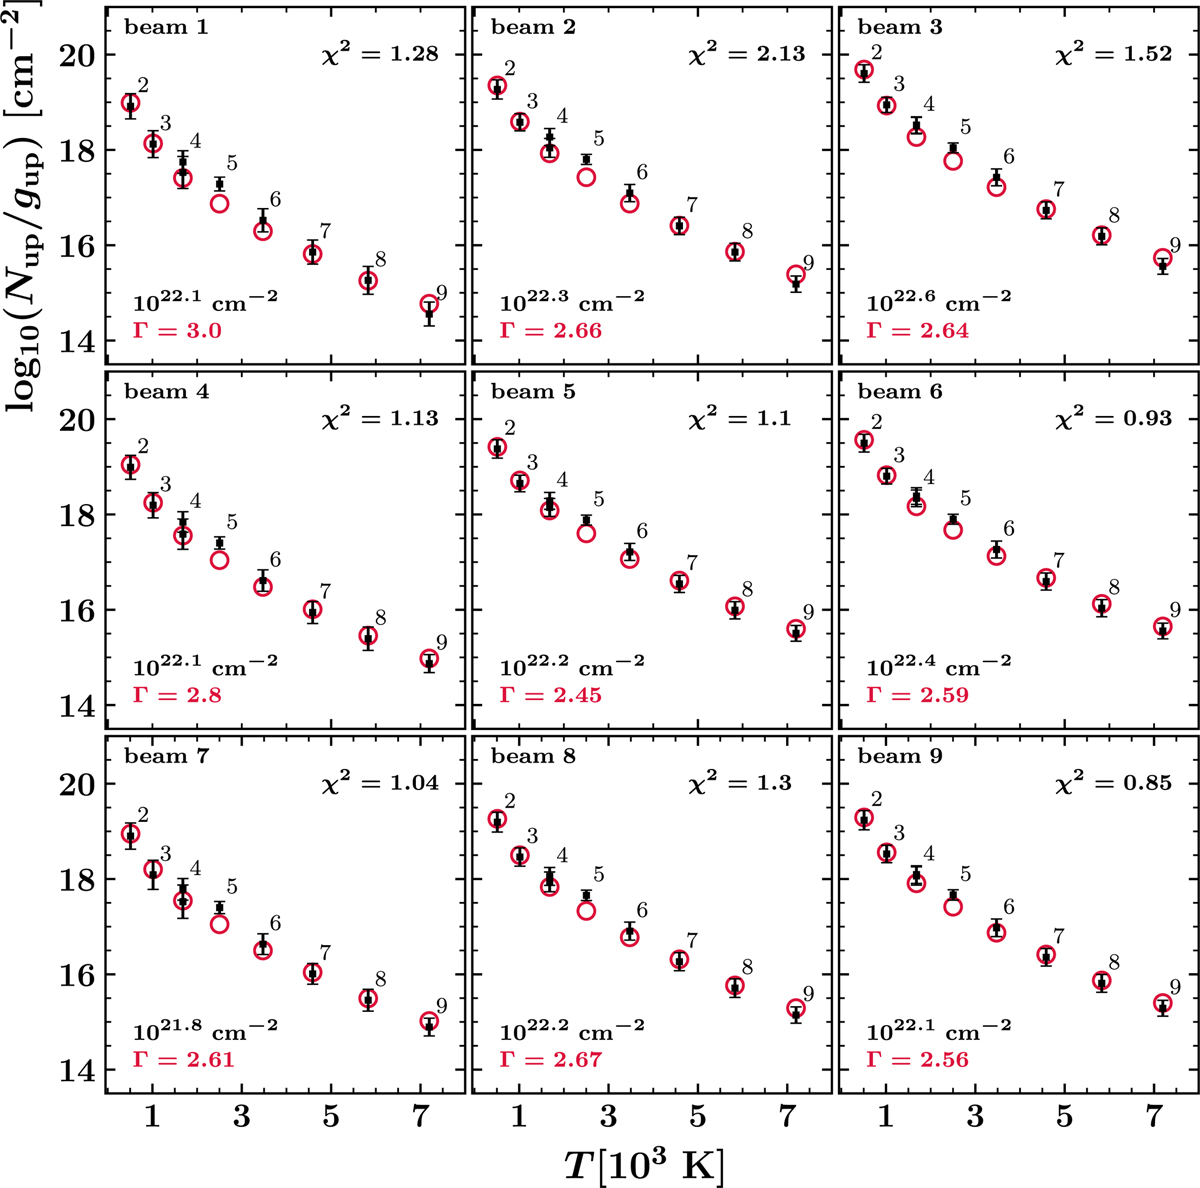
Fig. 9
Download original image
Population diagrams extracted from the positions shown in Fig. 3 and corresponding to the chi-square test shown in Fig. 8. The black data points represent the Nup measurements and their uncertainties. The red circles represent the best-fit non-LTE model obtained for the S(0) to S(7) transitions. The corresponding power-law indices and total column densities are shown in the bottom-left corner of the diagrams. The results of the χ2 test (see text) are presented in the top-right corner of the diagrams. The order of the diagrams (from left to right and top to bottom) is the same as the order of the white circles in Fig. 3.
Current usage metrics show cumulative count of Article Views (full-text article views including HTML views, PDF and ePub downloads, according to the available data) and Abstracts Views on Vision4Press platform.
Data correspond to usage on the plateform after 2015. The current usage metrics is available 48-96 hours after online publication and is updated daily on week days.
Initial download of the metrics may take a while.