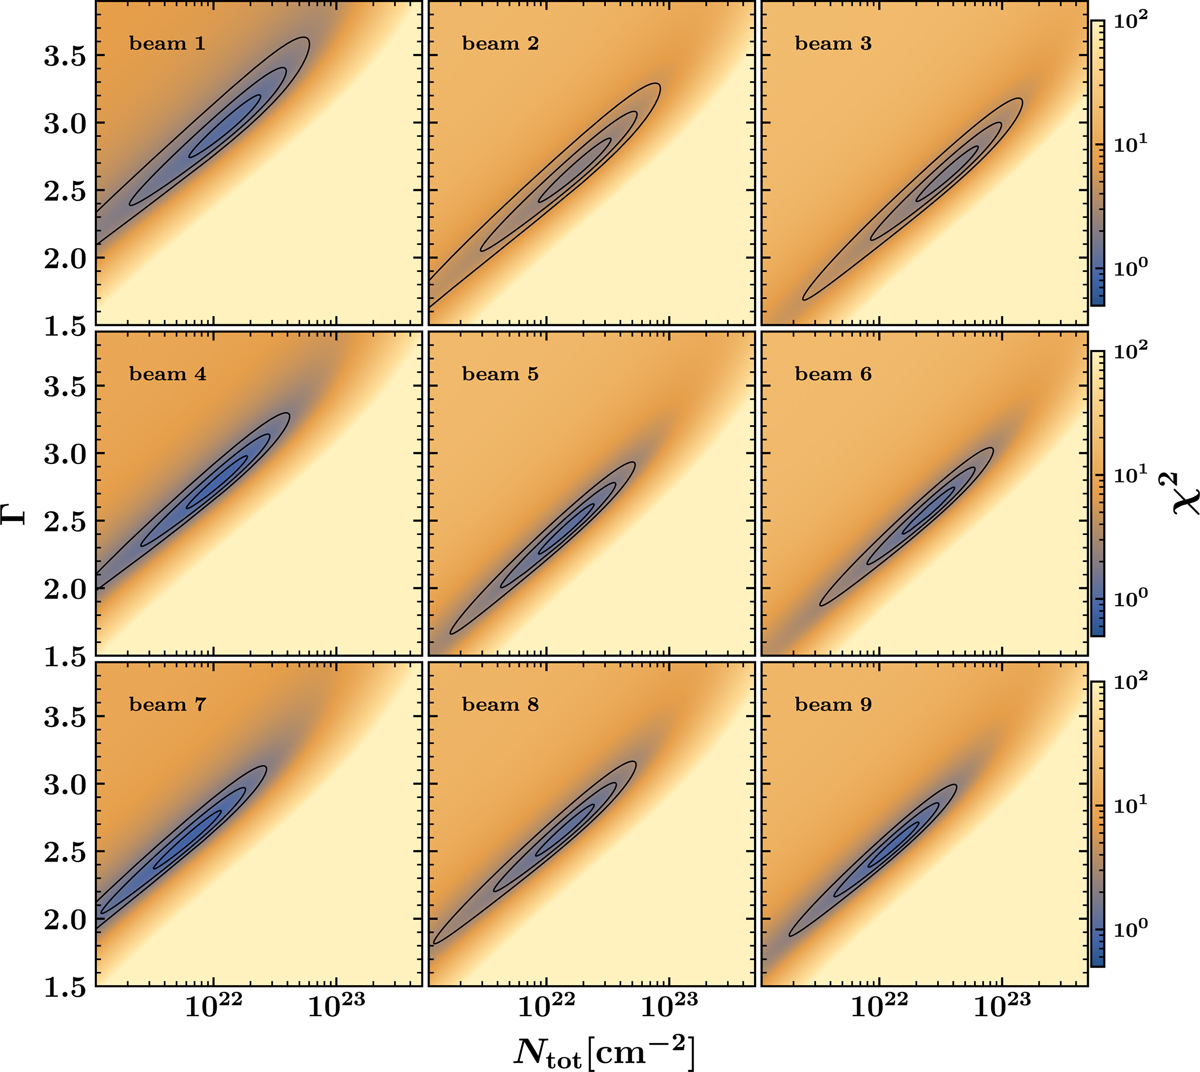
Fig. 8
Download original image
Results of the chi-square test applied to our observations and the non-LTE model grid of the S(0) to S(7) H2 lines integrated intensities (see Eq. (8)). Each panel of the mosaic corresponds to the panels shown in Fig. 9 (positions indicated in Fig. 3). The term Γ is the power-law index, and Ntot is the total column density for T > Tmin = 25 K (see Eqs. (6) and (7)). The background color indicates the absolute value of χ2, and the set of black contours indicate the inner areas corresponding to the 1σ, 2σ, and 3σ levels, that is, ![]() , where
, where ![]() is the minimum value of χ2 across the model grid
is the minimum value of χ2 across the model grid ![]() where σ is the measurement error, N is the number of measurements, and p is the number of fit parameters).
where σ is the measurement error, N is the number of measurements, and p is the number of fit parameters).
Current usage metrics show cumulative count of Article Views (full-text article views including HTML views, PDF and ePub downloads, according to the available data) and Abstracts Views on Vision4Press platform.
Data correspond to usage on the plateform after 2015. The current usage metrics is available 48-96 hours after online publication and is updated daily on week days.
Initial download of the metrics may take a while.