Open Access
Fig. 6
Download original image
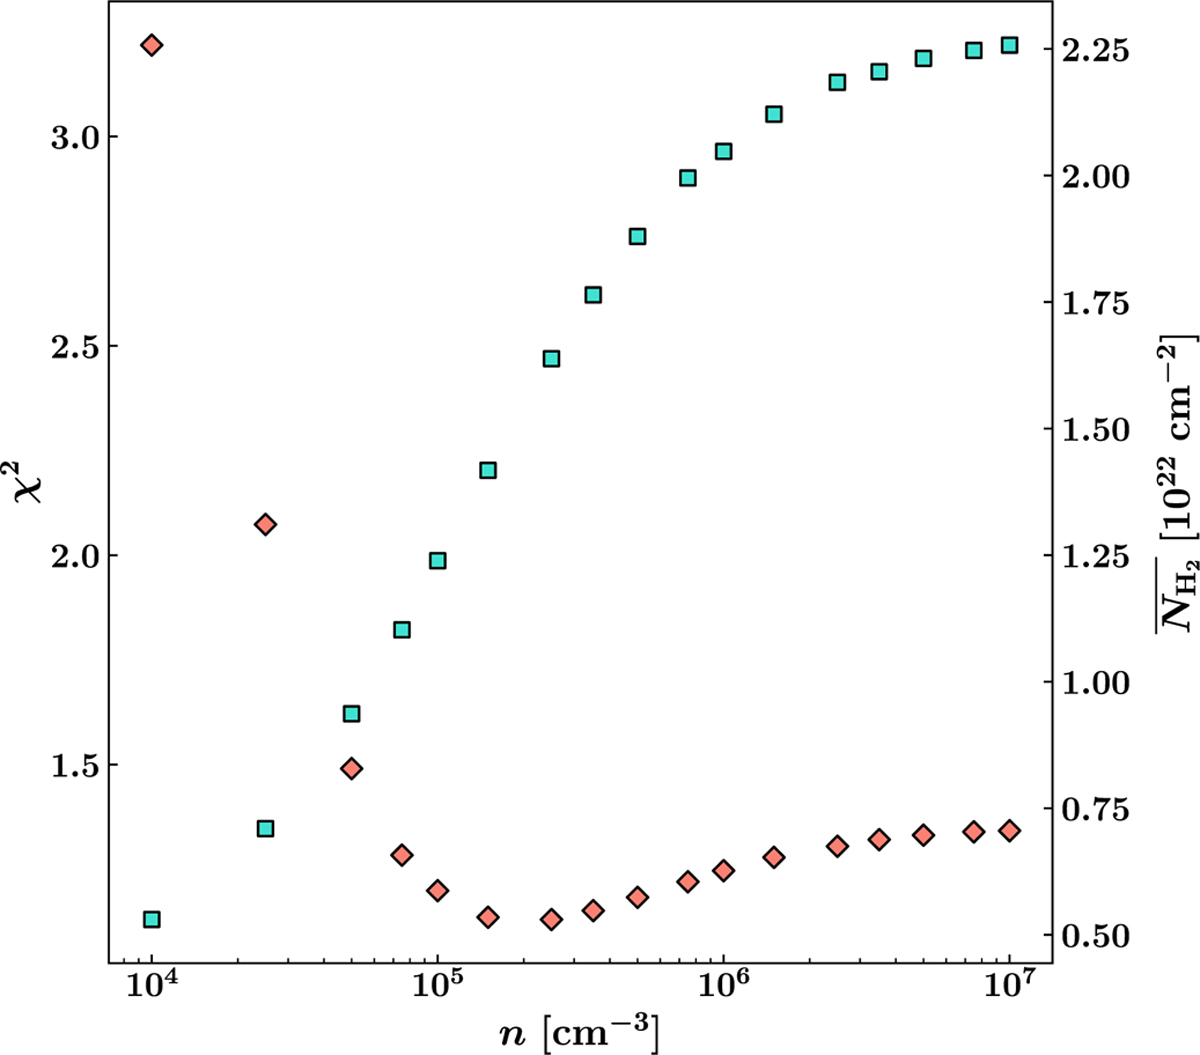
Average chi-square (‘χ2’, i.e., the average chi-square across the map, indicated by red diamonds) and average column density (![]() , indicated by turquoise squares) with respect to the adopted local density. The best-fit model was found with a density n = 2.5 × 105 cm−3, corresponding to χ2 = 1.13 and
, indicated by turquoise squares) with respect to the adopted local density. The best-fit model was found with a density n = 2.5 × 105 cm−3, corresponding to χ2 = 1.13 and ![]()
Current usage metrics show cumulative count of Article Views (full-text article views including HTML views, PDF and ePub downloads, according to the available data) and Abstracts Views on Vision4Press platform.
Data correspond to usage on the plateform after 2015. The current usage metrics is available 48-96 hours after online publication and is updated daily on week days.
Initial download of the metrics may take a while.