Fig. 5
Download original image
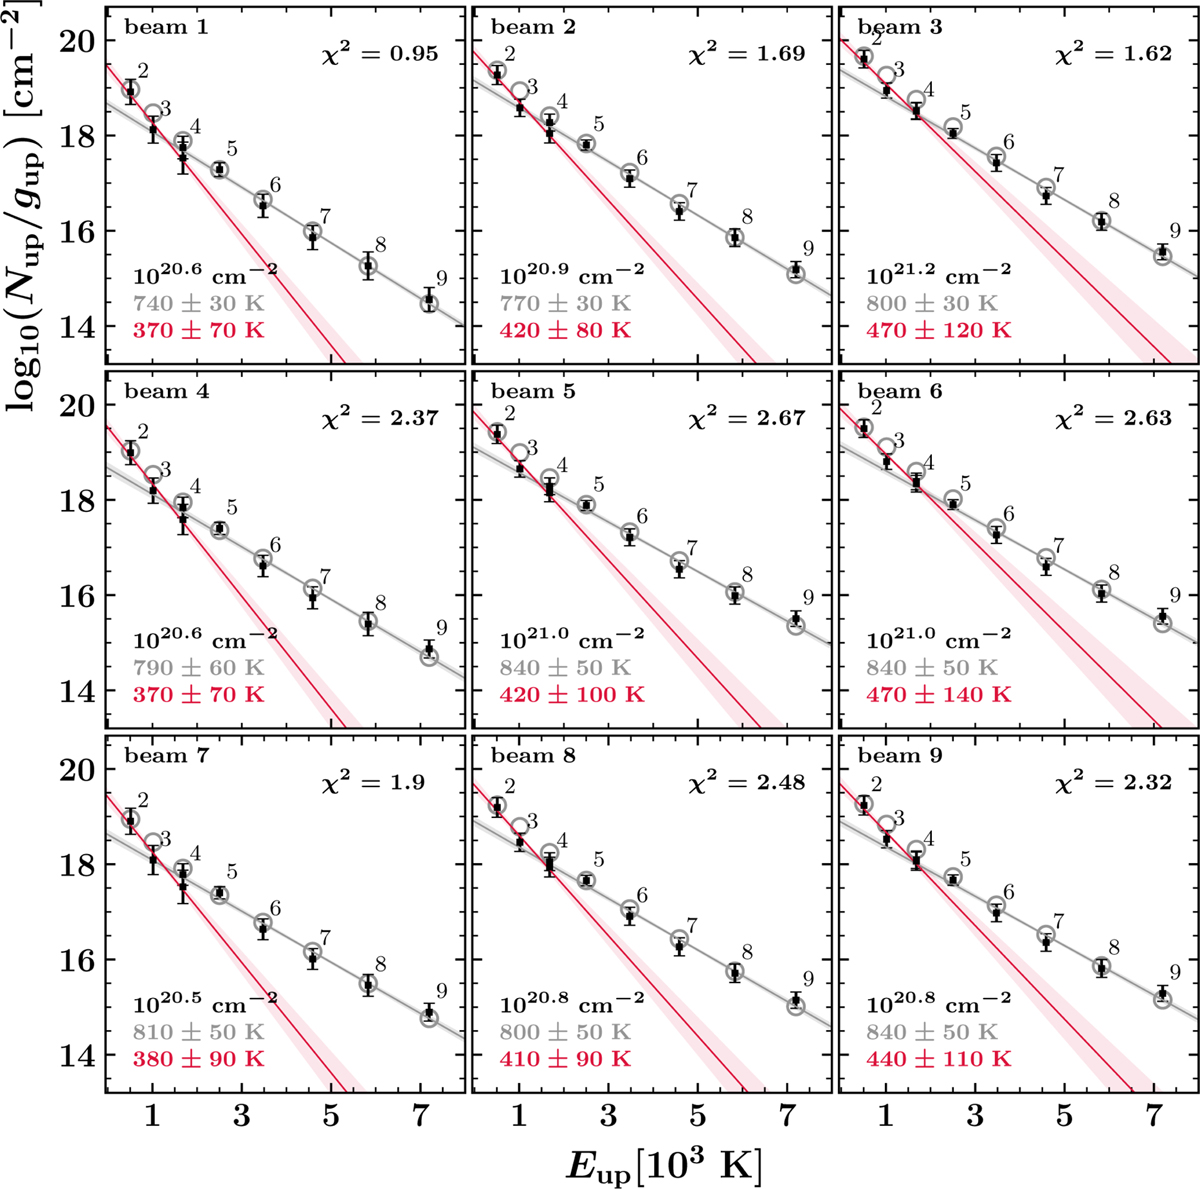
Population diagrams extracted from the positions shown in Fig. 3. The corresponding positions are indicated in the top-left corner of each panel. The black data points represent the Nup measurements and their uncertainties. The gray curve represents the linear model obtained for the S(3) to S(7) transitions. The red curve represents the linear model obtained for the S(0) to S(2) transitions. Gray circles represent the sum of the two models for each transition. The errors associated with the best linear models are represented by a filled area around the curves. The corresponding excitation temperatures are shown in the bottom-left corner of the diagrams ('cold' component in red and 'warm' component in gray). The total column density is also shown (in black). The results of the χ2 test (see text and Eq. (5)) are presented in the top-right corner of the diagrams. The order of the diagrams (from left to right and top to bottom) is the same as the order of the white circles in Fig. 3.
Current usage metrics show cumulative count of Article Views (full-text article views including HTML views, PDF and ePub downloads, according to the available data) and Abstracts Views on Vision4Press platform.
Data correspond to usage on the plateform after 2015. The current usage metrics is available 48-96 hours after online publication and is updated daily on week days.
Initial download of the metrics may take a while.