Open Access
Fig. 4
Download original image
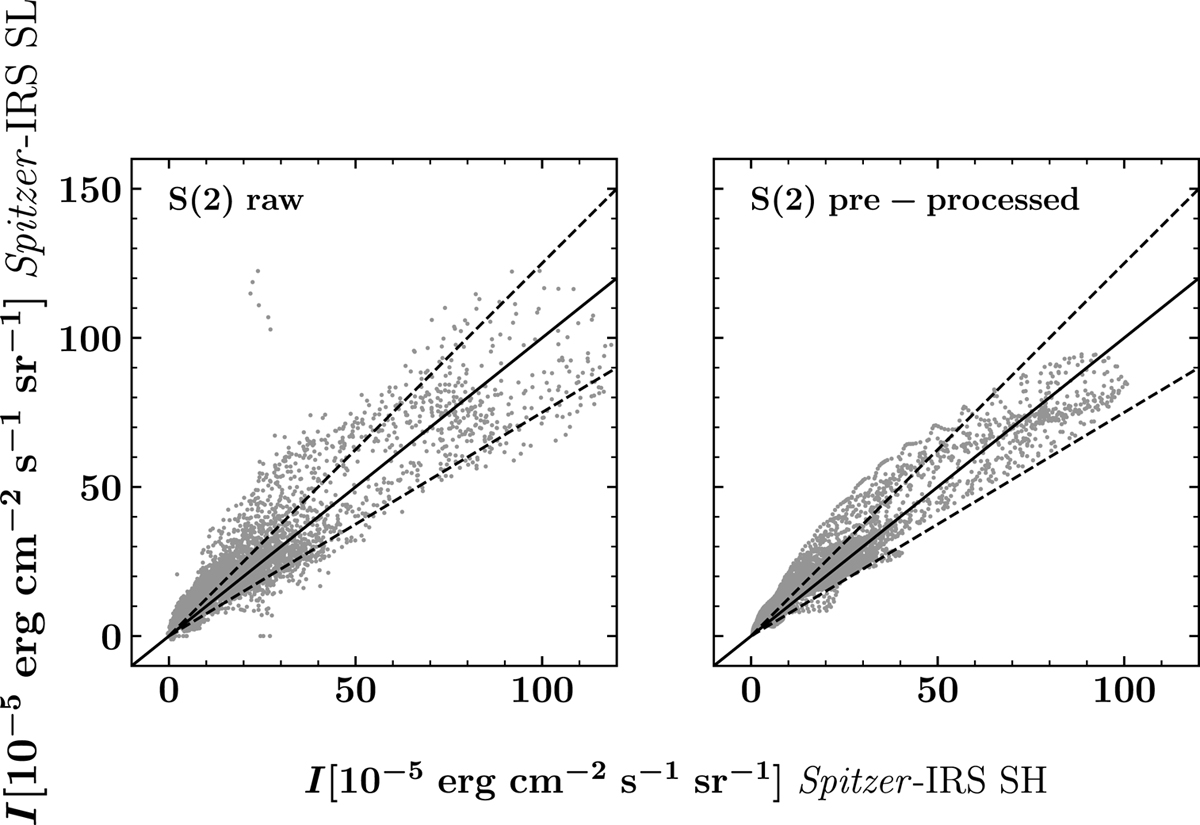
Pixel-per-pixel comparison of the integrated intensity S(2) maps measured by the Spitɀer/IRS SH and SL modules before (left panel) and after pre-processing (rightpanel). The solid lines represents the 1:1 relation expected if the SH and SL data arrays were identical, and the dashed lines represent the ±25% relative errors.
Current usage metrics show cumulative count of Article Views (full-text article views including HTML views, PDF and ePub downloads, according to the available data) and Abstracts Views on Vision4Press platform.
Data correspond to usage on the plateform after 2015. The current usage metrics is available 48-96 hours after online publication and is updated daily on week days.
Initial download of the metrics may take a while.