Fig. 3
Download original image
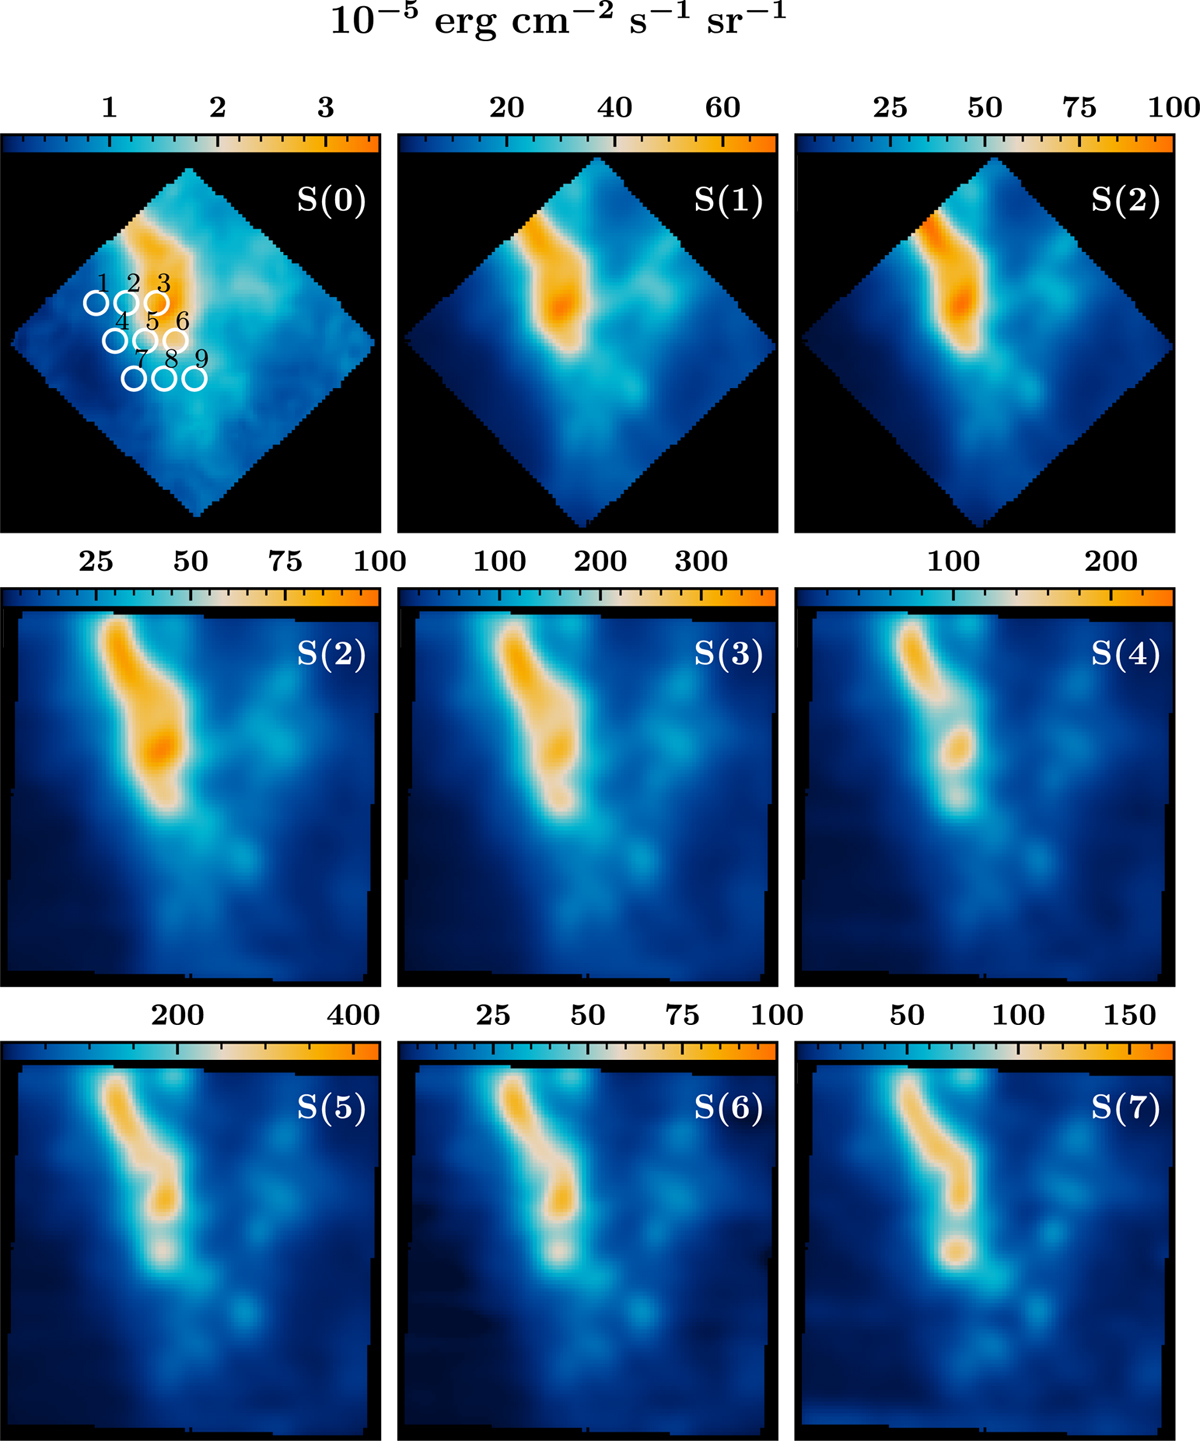
H2 υ = 0–0 S(0) to S(7) pre-processed maps obtained with Spitɀer/IRS toward the region IC443G. The S(1) to S(7) maps were convolved to the spatial resolution of the S(0) map (8″.3, see Sect. 4.2). The S(0) line was mapped by the LH module, the S(1) and S(2) lines were mapped by the SH modules, and the rest were mapped by the SL module. The S(2) line was mapped by both the SH (top row) and SL (second row) modules. The coordinates of the field of observations are indicated in Fig. 2. Raw maps are shown in Fig. A.1. The array of white circles indicates the positions in which we extracted the signals of the S(0) to S(7) spectral-line maps to produce the population diagram mosaics presented in Fig. 5 (model 1: standard LTE approach) and Fig. 9 (model 2: H2 thermal admixture model). The size of the circles corresponds to the angular resolution of the S(0) observations, that is, 8″.3 in diameter.
Current usage metrics show cumulative count of Article Views (full-text article views including HTML views, PDF and ePub downloads, according to the available data) and Abstracts Views on Vision4Press platform.
Data correspond to usage on the plateform after 2015. The current usage metrics is available 48-96 hours after online publication and is updated daily on week days.
Initial download of the metrics may take a while.