Open Access
Fig. 2
Download original image
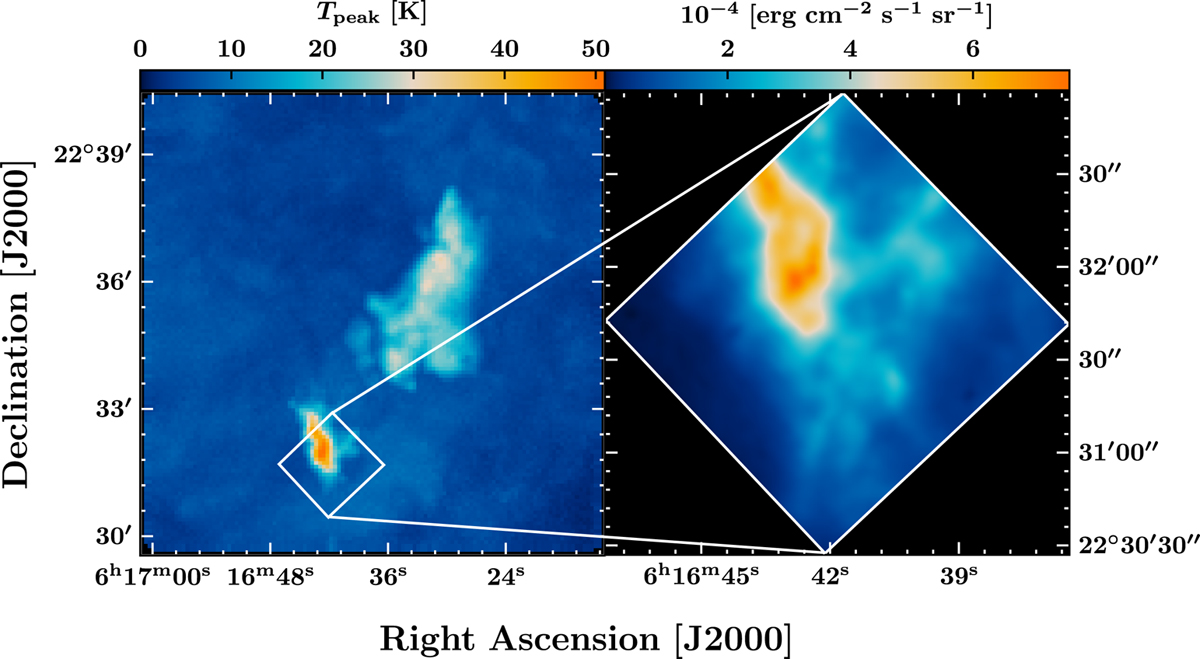
Finderchart of the Spitɀer/IRS field of observations. Left: 12CO J = 2−1 10′ × 10′ map of the peak temperature obtained with the IRAM-30m telescope at an angular resolution of 11″.2 (Dell’Ova et al. 2020). Right: H2 υ = 0–0 S(1) map of the integrated line intensity obtained with Spitɀer/IRS.
Current usage metrics show cumulative count of Article Views (full-text article views including HTML views, PDF and ePub downloads, according to the available data) and Abstracts Views on Vision4Press platform.
Data correspond to usage on the plateform after 2015. The current usage metrics is available 48-96 hours after online publication and is updated daily on week days.
Initial download of the metrics may take a while.