Fig. 12
Download original image
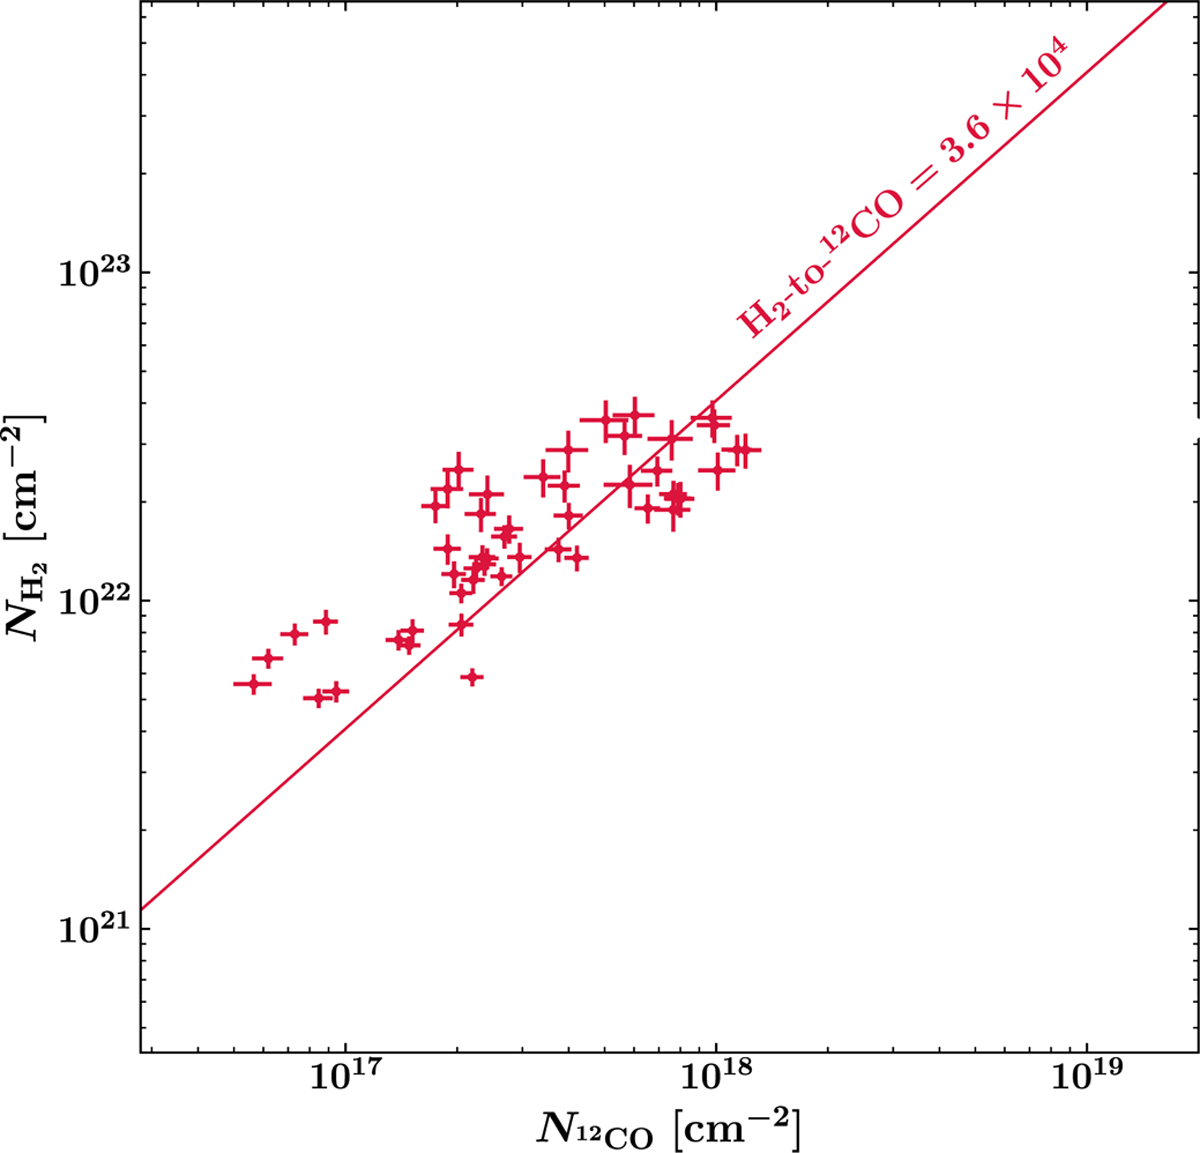
Pixel-per-pixel comparison of the 12CO and H2 total column density maps. The maps are restricted to the field of observations mapped by both Spitzer/IRS, IRAM-30m, and APEX telescopes. The 12CO data points were obtained with opacity-corrected population diagrams Dell’Ova et al. (2020). The H2 data points correspond to the results obtained with the thermal admixture SE description (see Sect. 5.2). We show the best linear fit associated with the sample of data points and the corresponding H2-to-12CO molecular abundance.
Current usage metrics show cumulative count of Article Views (full-text article views including HTML views, PDF and ePub downloads, according to the available data) and Abstracts Views on Vision4Press platform.
Data correspond to usage on the plateform after 2015. The current usage metrics is available 48-96 hours after online publication and is updated daily on week days.
Initial download of the metrics may take a while.