Fig. 11
Download original image
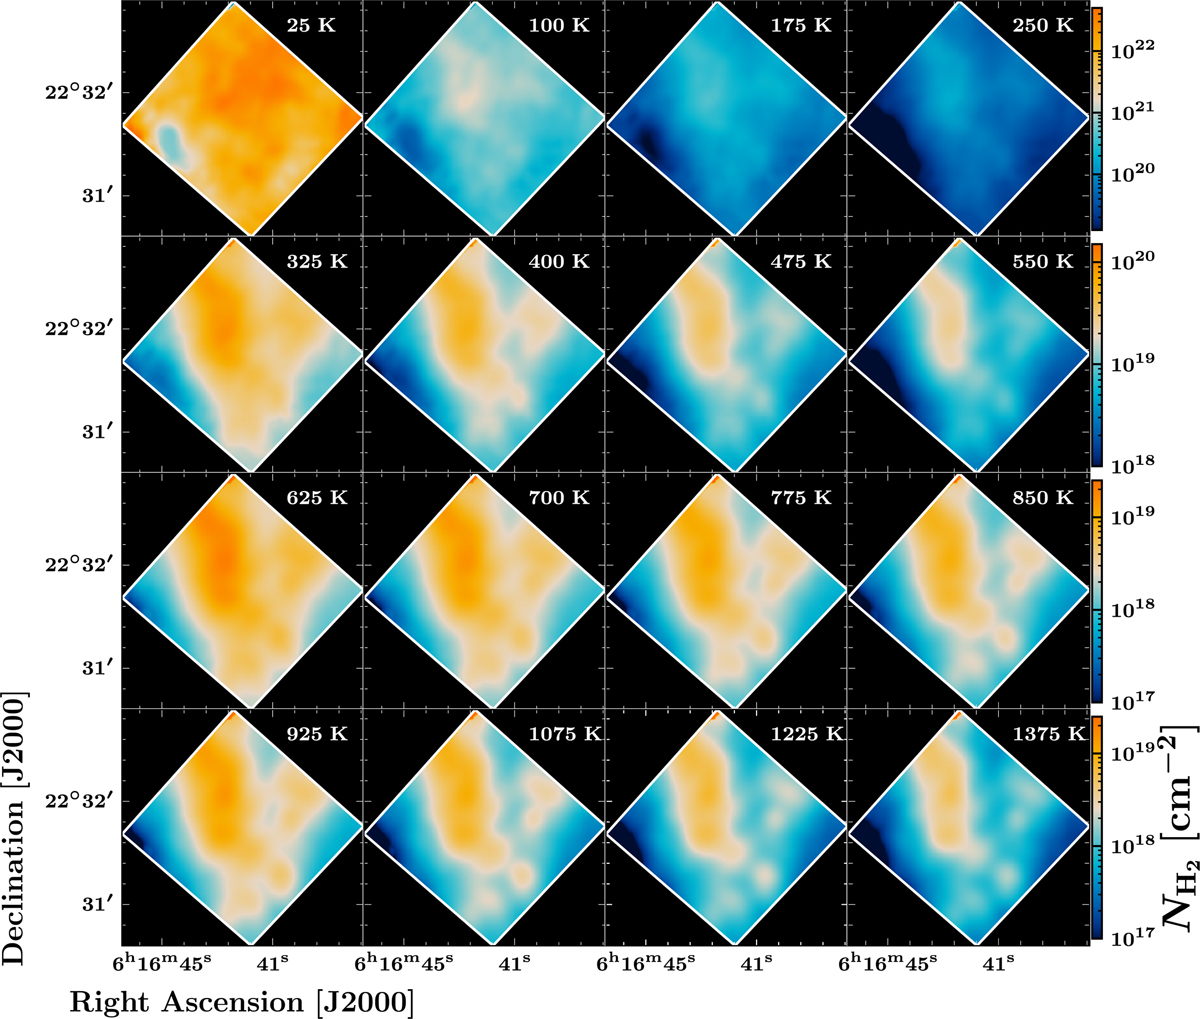
Tomographic representation of ![]() produced using the best-fit parameters (Λ, Γ). Each panel represents the partial column density map (defined by Eq. (B.4)) corresponding to a temperature bin ∆T (∆T = 75 K for the first three rows and ∆T = 150 K for the last row). The temperature T indicated in the top-right corner of each panel is the lower bound of the temperature interval on which the total column density is integrated (i.e., the upper bound is T + ∆T). Note: the color scale changes between rows.
produced using the best-fit parameters (Λ, Γ). Each panel represents the partial column density map (defined by Eq. (B.4)) corresponding to a temperature bin ∆T (∆T = 75 K for the first three rows and ∆T = 150 K for the last row). The temperature T indicated in the top-right corner of each panel is the lower bound of the temperature interval on which the total column density is integrated (i.e., the upper bound is T + ∆T). Note: the color scale changes between rows.
Current usage metrics show cumulative count of Article Views (full-text article views including HTML views, PDF and ePub downloads, according to the available data) and Abstracts Views on Vision4Press platform.
Data correspond to usage on the plateform after 2015. The current usage metrics is available 48-96 hours after online publication and is updated daily on week days.
Initial download of the metrics may take a while.