Fig. 10
Download original image
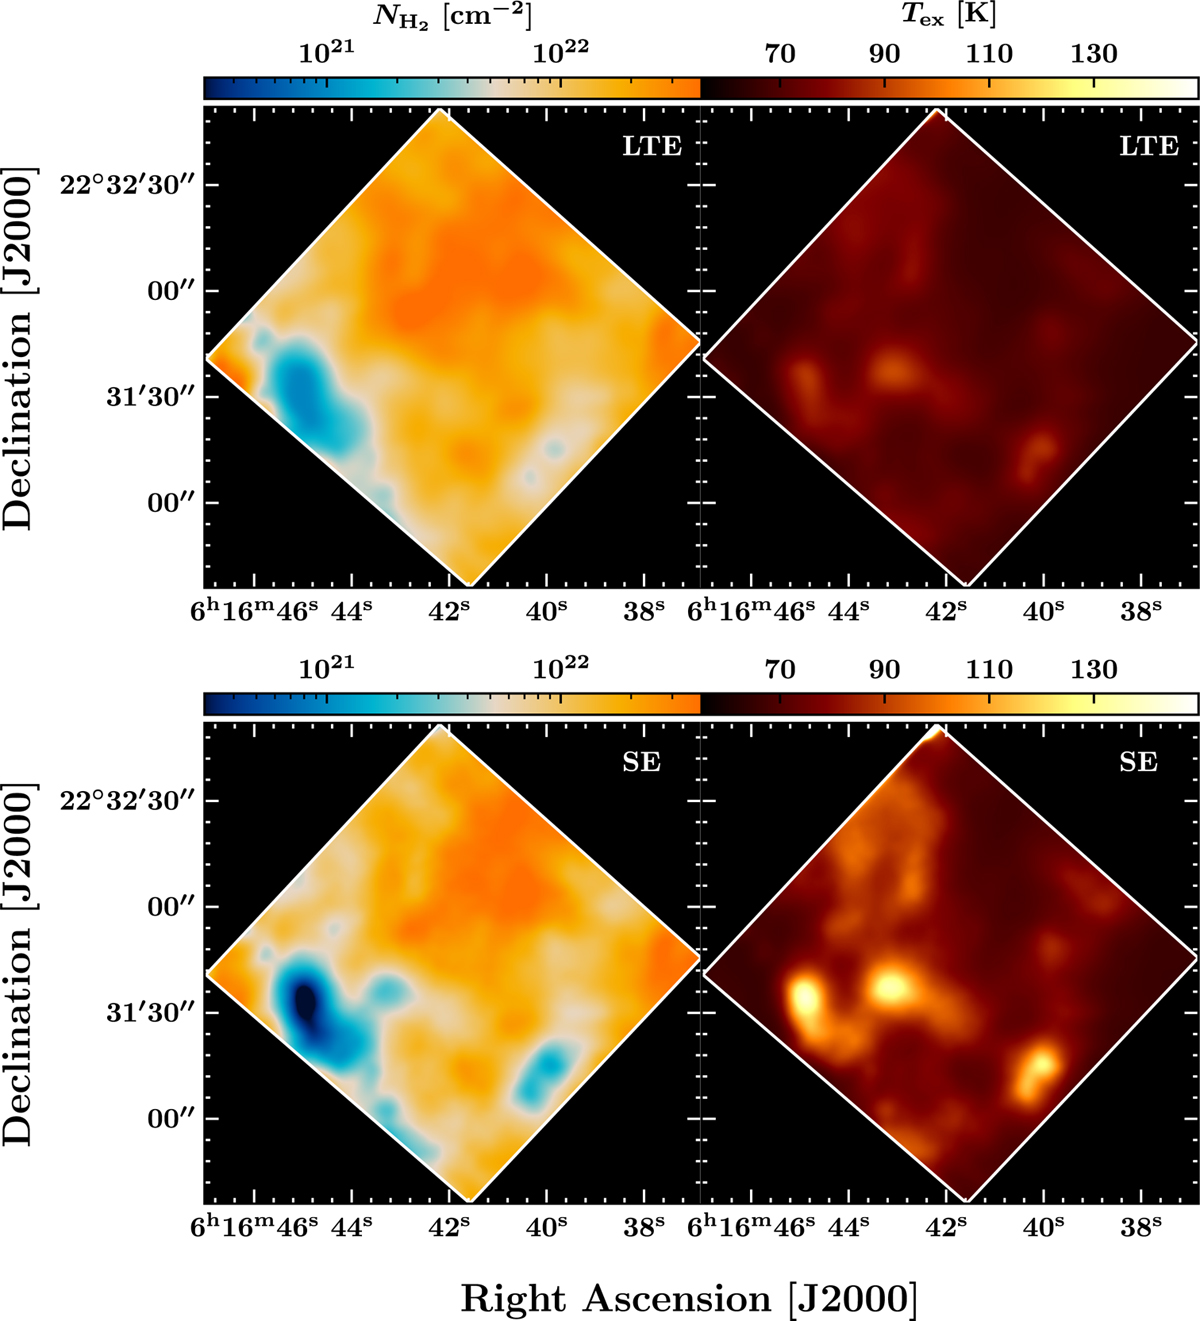
Resulting images from the LTE and SE analyses. Top panel: column density (left) and excitation temperature (right) derived from the analysis of the S(0) to S(7) H2 pure rotational lines, following the LTE method described in Sect. 5.2. Bottom panel: column density (left) and kinetic temperature (right) derived from the SE analysis described in Sect. 5.2.
Current usage metrics show cumulative count of Article Views (full-text article views including HTML views, PDF and ePub downloads, according to the available data) and Abstracts Views on Vision4Press platform.
Data correspond to usage on the plateform after 2015. The current usage metrics is available 48-96 hours after online publication and is updated daily on week days.
Initial download of the metrics may take a while.