Fig. 1
Download original image
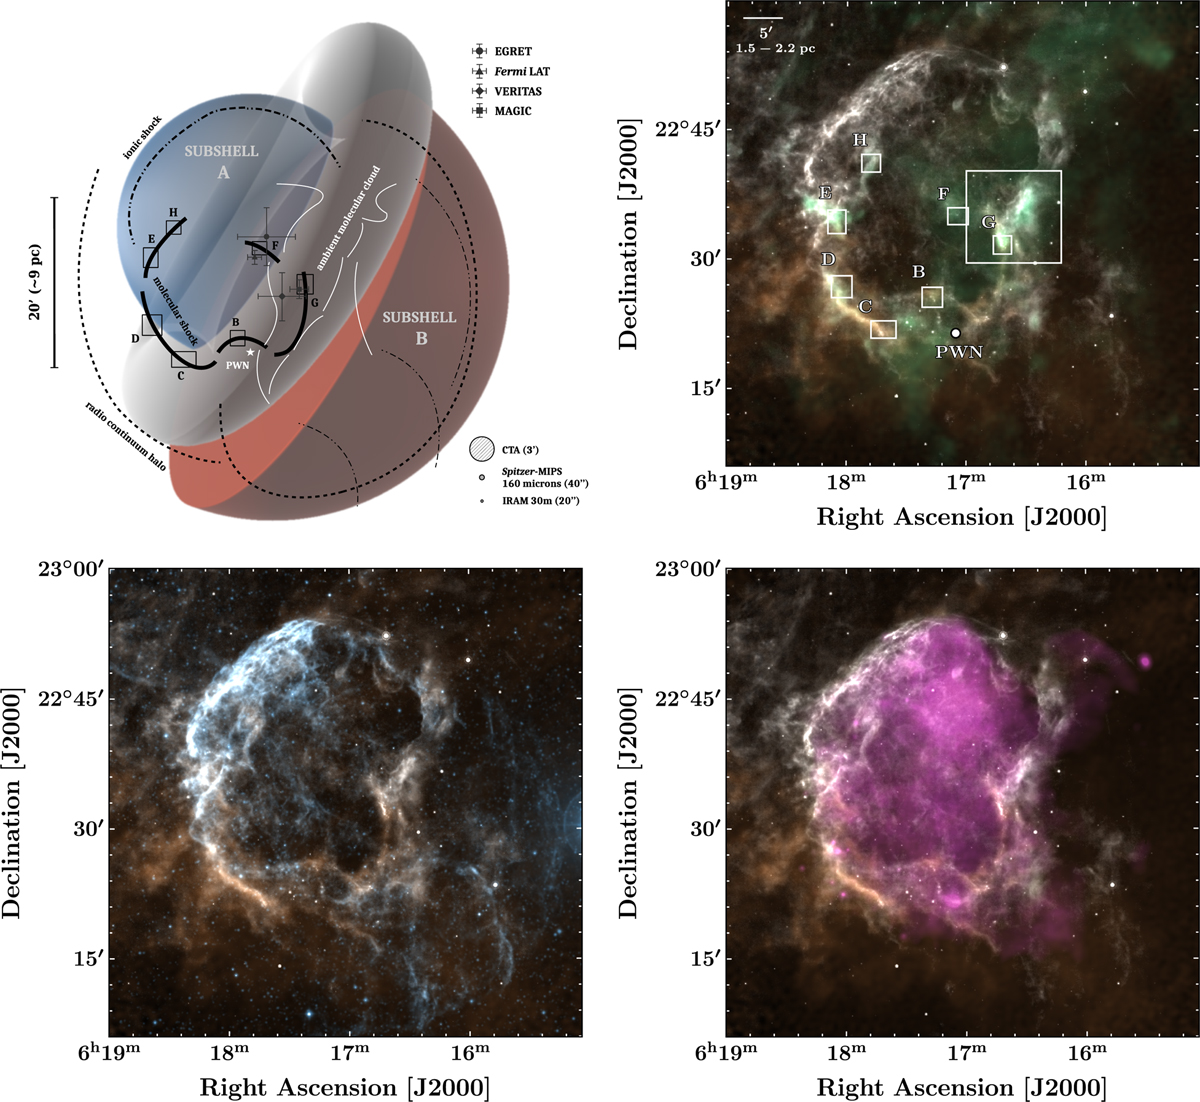
Overview of the SNR IC443. Top-left panel: schematic drawing of the SNR morphology. The two-shell model proposed by Troja et al. (2006) is shown as a colored background image: the gray torus represents the molecular cloud discovered by Cornett et al. (1977) and is highlighted by white curved lines based on the higher resolution observations by Lee et al. (2012). The blue hemisphere labeled “subshell A” represents the shock front in the eastern region. In the northeast, where it has been confined by the encounter with the neutral H I cloud of Denoyer (1978), the ionic shock front is traced by optical, infrared and very soft X-ray emission (Alarie & Drissen 2019, dashed-dotted black lines). In the southern region, the thick black curved lines represent the areas of interaction with the molecular cloud and the shocked H2 ridges of Burton et al. (1988). The labels and positions of the different molecular clumps identified by Denoyer (1979b) and Dickman et al. (1992) are indicated with capital letters (B, C, D, E, F, G, H). The red hemisphere labeled “subshell B” represents the shock front in the western region, where it is expanding in a homogeneous and less dense medium. The position of the PWN discovered by Olbert et al. (2001) is indicated by a white star. The extension of the radio continuum halo is shown by dashed black lines (Lee et al. 2008, later confirmed by Castelletti et al. 2011). Locations and extensions of the four gamma-ray peaks at different energy ranges are indicated: EGRET centroid (∘), MAGIC centroid (□), VERITAS centroid (◊), and Fermi LAT centroid (∆), respectively measured by Esposito et al. (1996), Albert et al. (2007), Acciari et al. (2009) and Abdo et al. (2010). The respective localization errors are shown as crosses of size 0.5 σ. We note that the high-energy emission is extended, and hence the relation between Fermi LAT, VERITAS, and MAGIC observations may be better characterized by the extent of the emission rather than the centroids. The sizes of typical instrumental beams are indicated in the bottom-right corner of the figure. The other panels represent color composite images of IC443, with H I 21 cm line emission (Lee et al. 2008) in yellow and 24 µm (Spitɀer/MIPS) emission in white in all three panels. The third color channel represents a distinct signal in each panel: top-right panel: 12CO J = 1–0 (Lee et al. 2012, green); bottom-left panel: DSS optical observations (York et al. 2000, blue); bottom-right panel: XMM-Newton observations at 1.4–5 keV (Greco et al. 2018, purple).
Current usage metrics show cumulative count of Article Views (full-text article views including HTML views, PDF and ePub downloads, according to the available data) and Abstracts Views on Vision4Press platform.
Data correspond to usage on the plateform after 2015. The current usage metrics is available 48-96 hours after online publication and is updated daily on week days.
Initial download of the metrics may take a while.