Open Access
Fig. 9.
Download original image
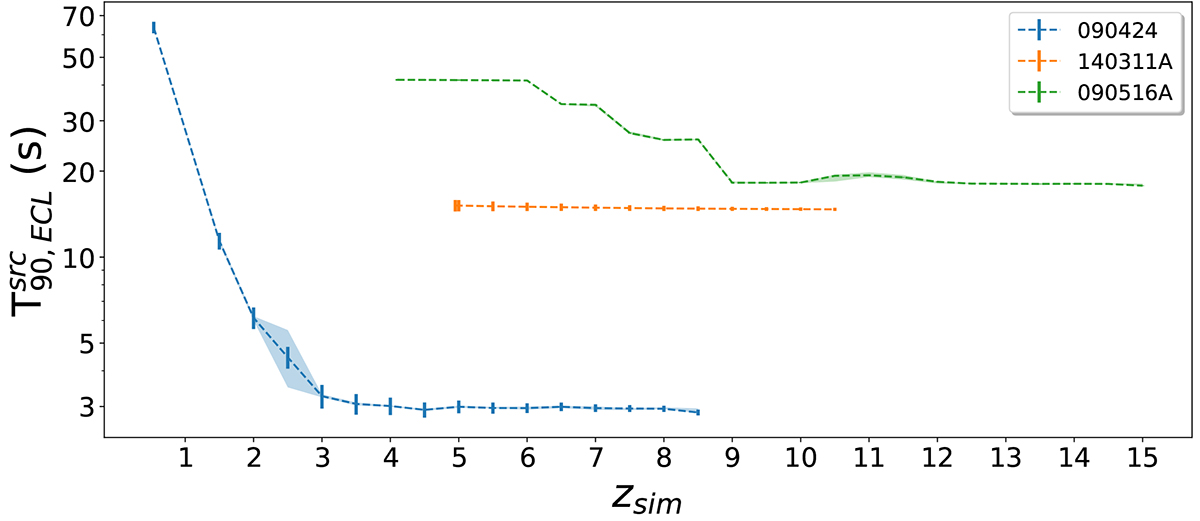
Evolution of ![]() with respect to zsim for GRB 140311A, GRB 090424, and GRB 090516A. The T90 values and error bars shown correspond to the median of 100 trials, derived with battblocks. The 90% confidence interval of the median is shown with a shaded region around the plotted curves.
with respect to zsim for GRB 140311A, GRB 090424, and GRB 090516A. The T90 values and error bars shown correspond to the median of 100 trials, derived with battblocks. The 90% confidence interval of the median is shown with a shaded region around the plotted curves.
Current usage metrics show cumulative count of Article Views (full-text article views including HTML views, PDF and ePub downloads, according to the available data) and Abstracts Views on Vision4Press platform.
Data correspond to usage on the plateform after 2015. The current usage metrics is available 48-96 hours after online publication and is updated daily on week days.
Initial download of the metrics may take a while.