Open Access
Fig. 4.
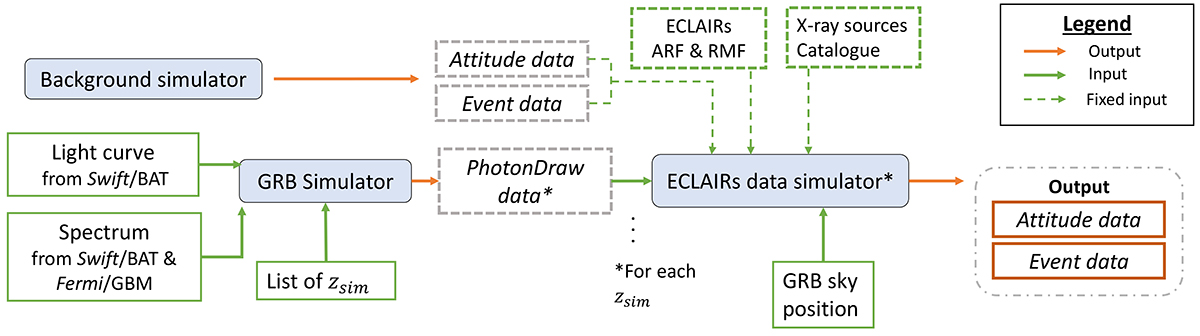
Download original image
Flowchart of the simulation structure. The three simulator tools used in the analysis are shown as the blue bricks. This process is parallelised for all simulated GRBs, sky positions, and redshift values.
Current usage metrics show cumulative count of Article Views (full-text article views including HTML views, PDF and ePub downloads, according to the available data) and Abstracts Views on Vision4Press platform.
Data correspond to usage on the plateform after 2015. The current usage metrics is available 48-96 hours after online publication and is updated daily on week days.
Initial download of the metrics may take a while.