Open Access
Fig. 3.
Download original image
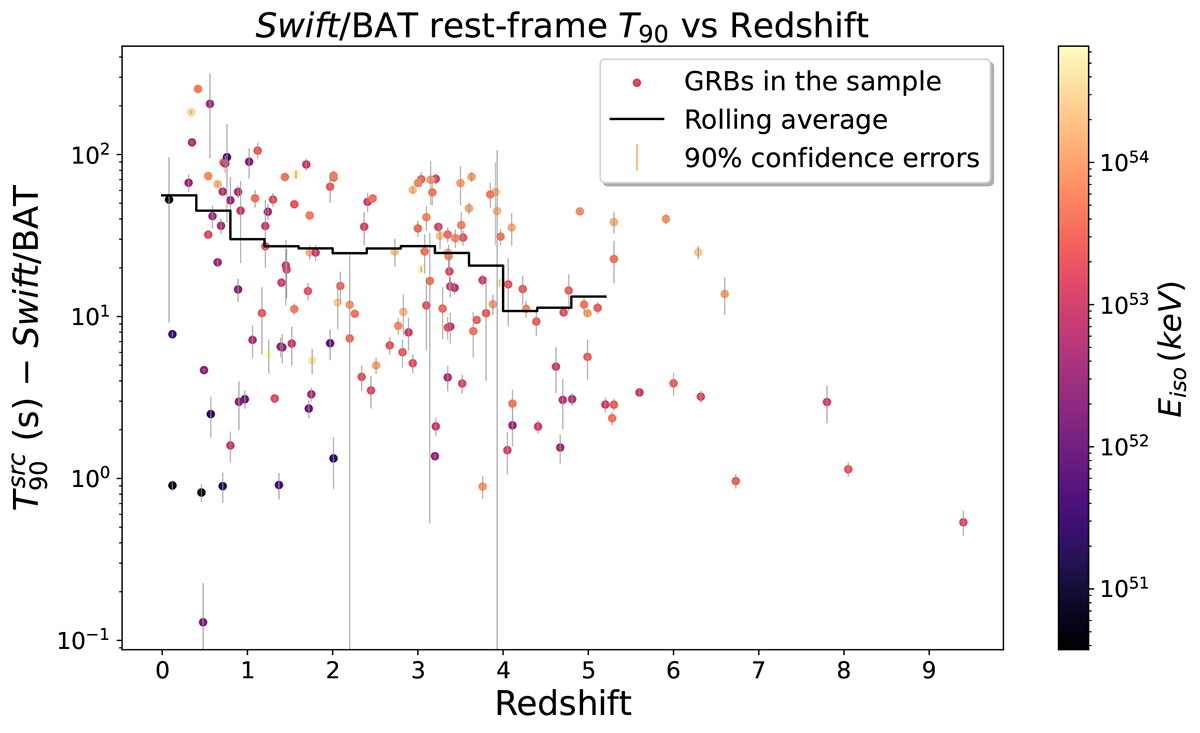
Rest-frame T90 as a function of redshift for the GRBs in the sample, colour-coded based on the bursts Eiso. The solid line corresponds to the ![]() rolling average up to z ∼ 5 computed in z-bins of unity size, spaced by 0.4 in redshift.
rolling average up to z ∼ 5 computed in z-bins of unity size, spaced by 0.4 in redshift.
Current usage metrics show cumulative count of Article Views (full-text article views including HTML views, PDF and ePub downloads, according to the available data) and Abstracts Views on Vision4Press platform.
Data correspond to usage on the plateform after 2015. The current usage metrics is available 48-96 hours after online publication and is updated daily on week days.
Initial download of the metrics may take a while.