Fig. 14.
Download original image
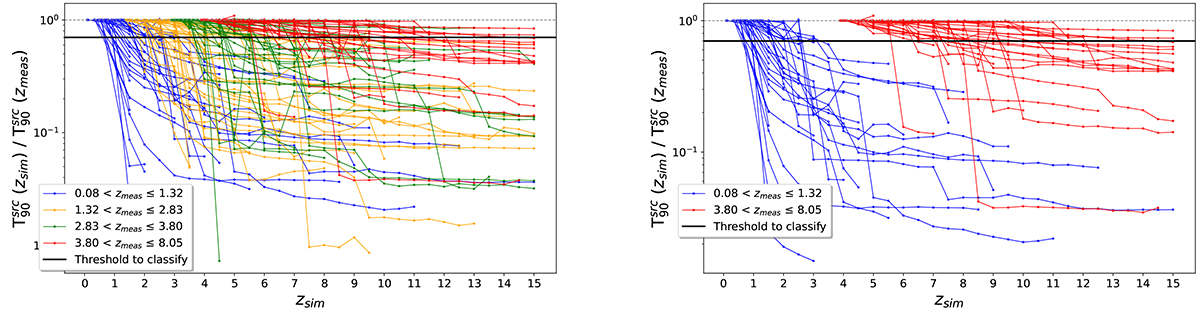
Evolution of ![]() at each zsim divided by the corresponding value at zmeas, for all GRBs in the sample. The curves are colour-coded according to the subset to which the GRBs belong. The black horizontal line shows the value used to categorise the GRBs according to their T90 evolution with redshift. The left panel contains all GRBs in the sample, while the right panel contains only those in the lowest-z and highest-z subsets.
at each zsim divided by the corresponding value at zmeas, for all GRBs in the sample. The curves are colour-coded according to the subset to which the GRBs belong. The black horizontal line shows the value used to categorise the GRBs according to their T90 evolution with redshift. The left panel contains all GRBs in the sample, while the right panel contains only those in the lowest-z and highest-z subsets.
Current usage metrics show cumulative count of Article Views (full-text article views including HTML views, PDF and ePub downloads, according to the available data) and Abstracts Views on Vision4Press platform.
Data correspond to usage on the plateform after 2015. The current usage metrics is available 48-96 hours after online publication and is updated daily on week days.
Initial download of the metrics may take a while.