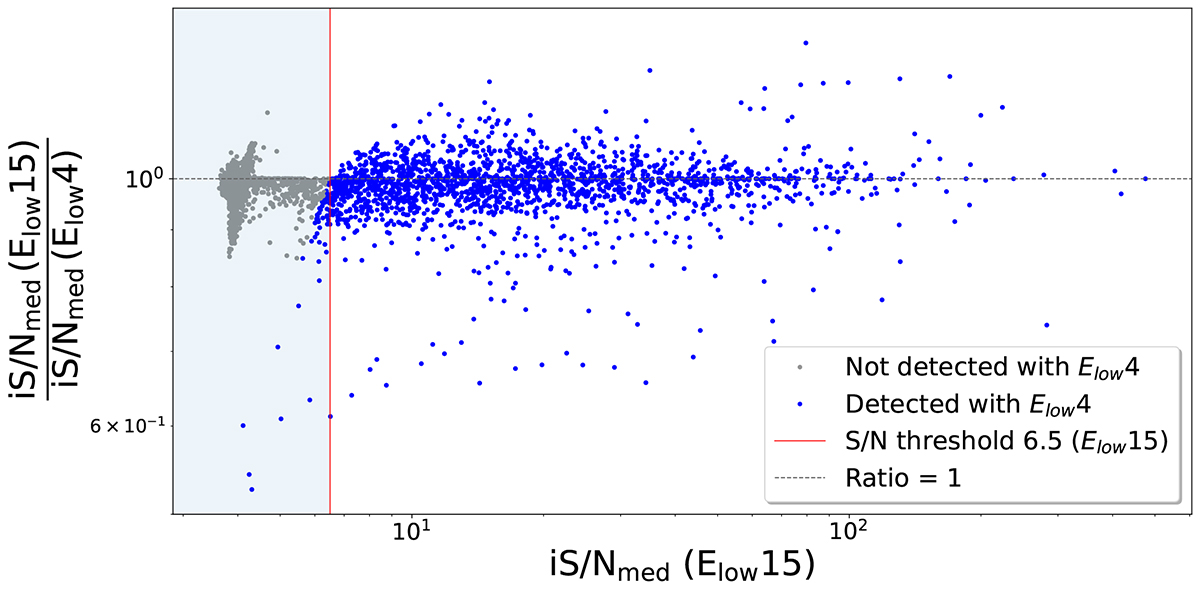
Fig. 11.
Download original image
Comparison of the iS/Nmed obtained with Elow values of 15 and 4 keV, for all GRBs, and redshift values simulated within the fcFoV. The blue and grey points represent respectively all successful and not successful detections with Elow = 4 keV. The red vertical line represents the iS/N threshold above which the successful detections with Elow = 15 keV lie.
Current usage metrics show cumulative count of Article Views (full-text article views including HTML views, PDF and ePub downloads, according to the available data) and Abstracts Views on Vision4Press platform.
Data correspond to usage on the plateform after 2015. The current usage metrics is available 48-96 hours after online publication and is updated daily on week days.
Initial download of the metrics may take a while.